Exploratory Desktop
Exploratory’s Simple UI experience makes it possible for anyone to use Data Science to Explore data quickly, Discover deeper insights, and Communicate effectively.
Data Science with Exploratory
In order to answer business questions with data, you need 5 pillars of Data Science tasks. They are Data Access, Data Wrangling, Visualization, Analytics, and Communication.
Exploratory’s simple UI experience provides not only the best capability in each area but also a natively integrated experience that is designed from the ground up.
Exploratory’s simple UI experience provides not only the best capability in each area but also a natively integrated experience that is designed from the ground up.

Data Access
You can quickly extract data from various built-in data sources such as Redshift, BigQuery, PostgreSQL, MySQL, Oracle, SQL Server, Vertica, MongoDB, Presto, Google Analytics, Google Spreadsheet, Twitter, Web Scraping, CSV, Excel, JSON, etc. or write your own R script!


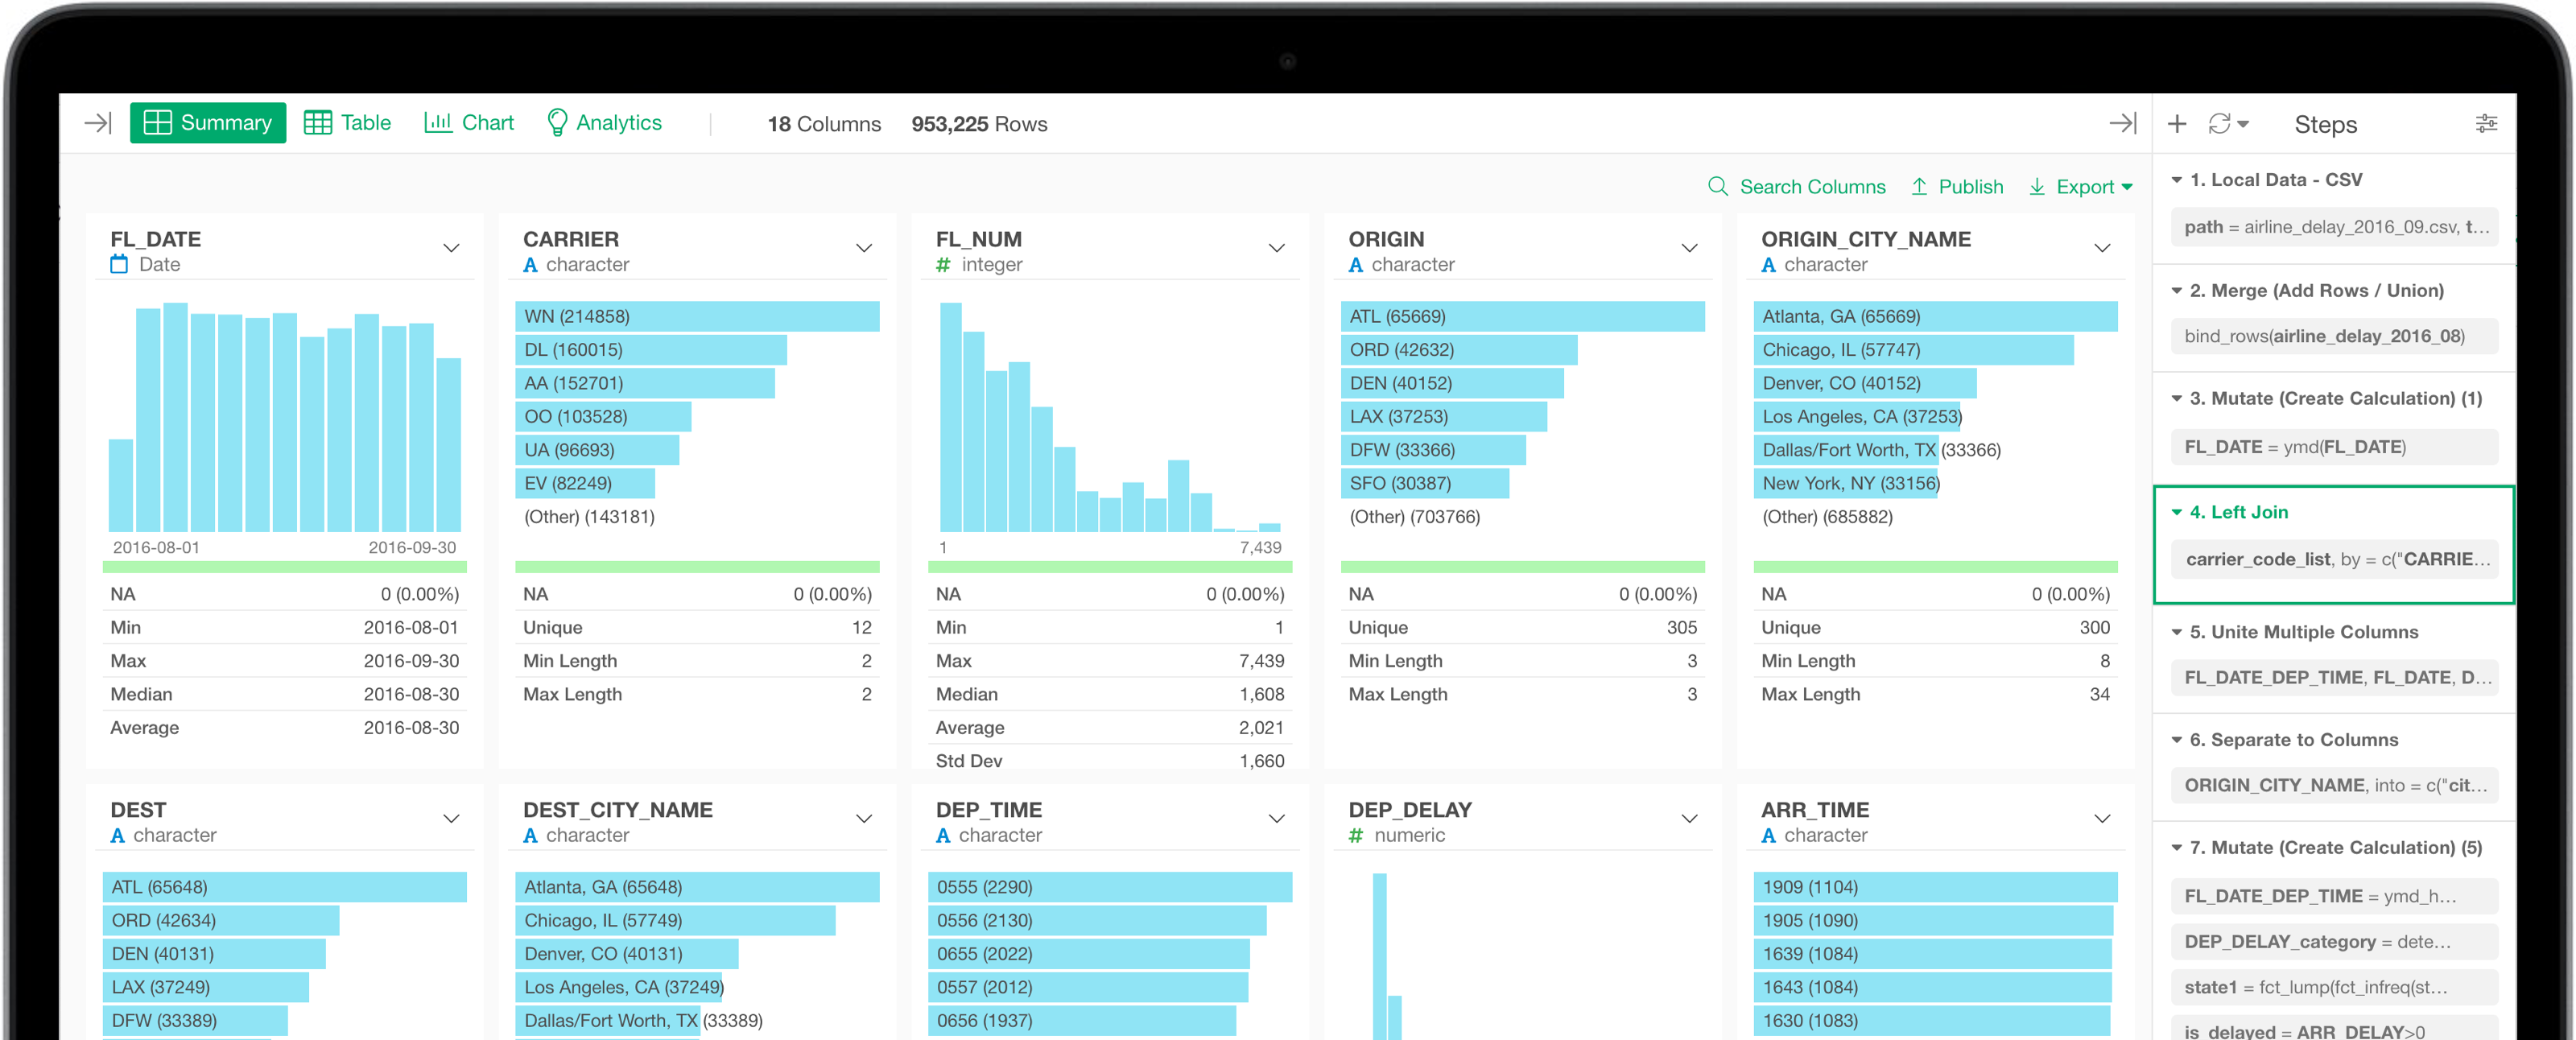
Data Wrangling
Exploratory’s simple and interactive UI experience makes data wrangling not just more effective, but also more fun.

Data Visualization
Exploratory’s simple UI makes it easy to visualize data with a wide range of chart types you need to explore your data and discover insights quickly.

Analytics
Statistics / Machine Learning
Whether you are just starting out or a seasoned Data Scientist, Exploratory’s simple UI experience makes it easy to use a wide range of open source Statistics and Machine Learning algorithms to explore data and gain deeper insights quickly.

Bayesian A/B Testing

Survival Analysis

Time Series Forecasting

Random Forest
Dashboard
Communication
You can create your Dashboards quickly and flexibly with Exploratory. Once you have created one, make them interactive with parameters, share them others securely, and schedule them to update the Dashboard with the latest data automatically.

Notes
Communication
Exploratory’s simple authoring experience makes it easier to write Notes to communicate your insights and stories. You can include charts, analytics, super parameters, images, videos, or even R scripts to make them interactive and more effective.

Share Data & Insights in Reproducible Way
You can share your Data, Chart, Dashboard, Note, and Slides all in a reproducible way. This means your teammates can import and reproduce them in their Exploratory so that they can extend them further.

Extend Beyond Exploratory
Exploratory is built on top of R. This means you have access to more than 15,000 data science-related open source packages. Extend Exploratory by bringing in your favorite R packages, creating your custom functions, GeoJSON Map files, data sources, and more.

R Script Editor

R Package Install
Knowledge Management
You can publish and share your insights at either Exploratory Cloud server or Exploratory Server installed on your own server. With Exploratory Insight Page you can manage your published contents effectively and discover insights from others quickly.

Learn by Doing
Are you new to Data Science? No worry!
Exploratory Desktop’s simple and modern UI experience lets you focus on learning various data science methods by using them rather than figuring out how to set up or writing codes.
With Exploratory Insight Page, you can find many step-by-step and easy-to-follow tutorials to learn various Data Science methods including Data Wrangling, Data Visualization, Statistics, Machine Learning, etc.


