How to Normalize Chart Colors
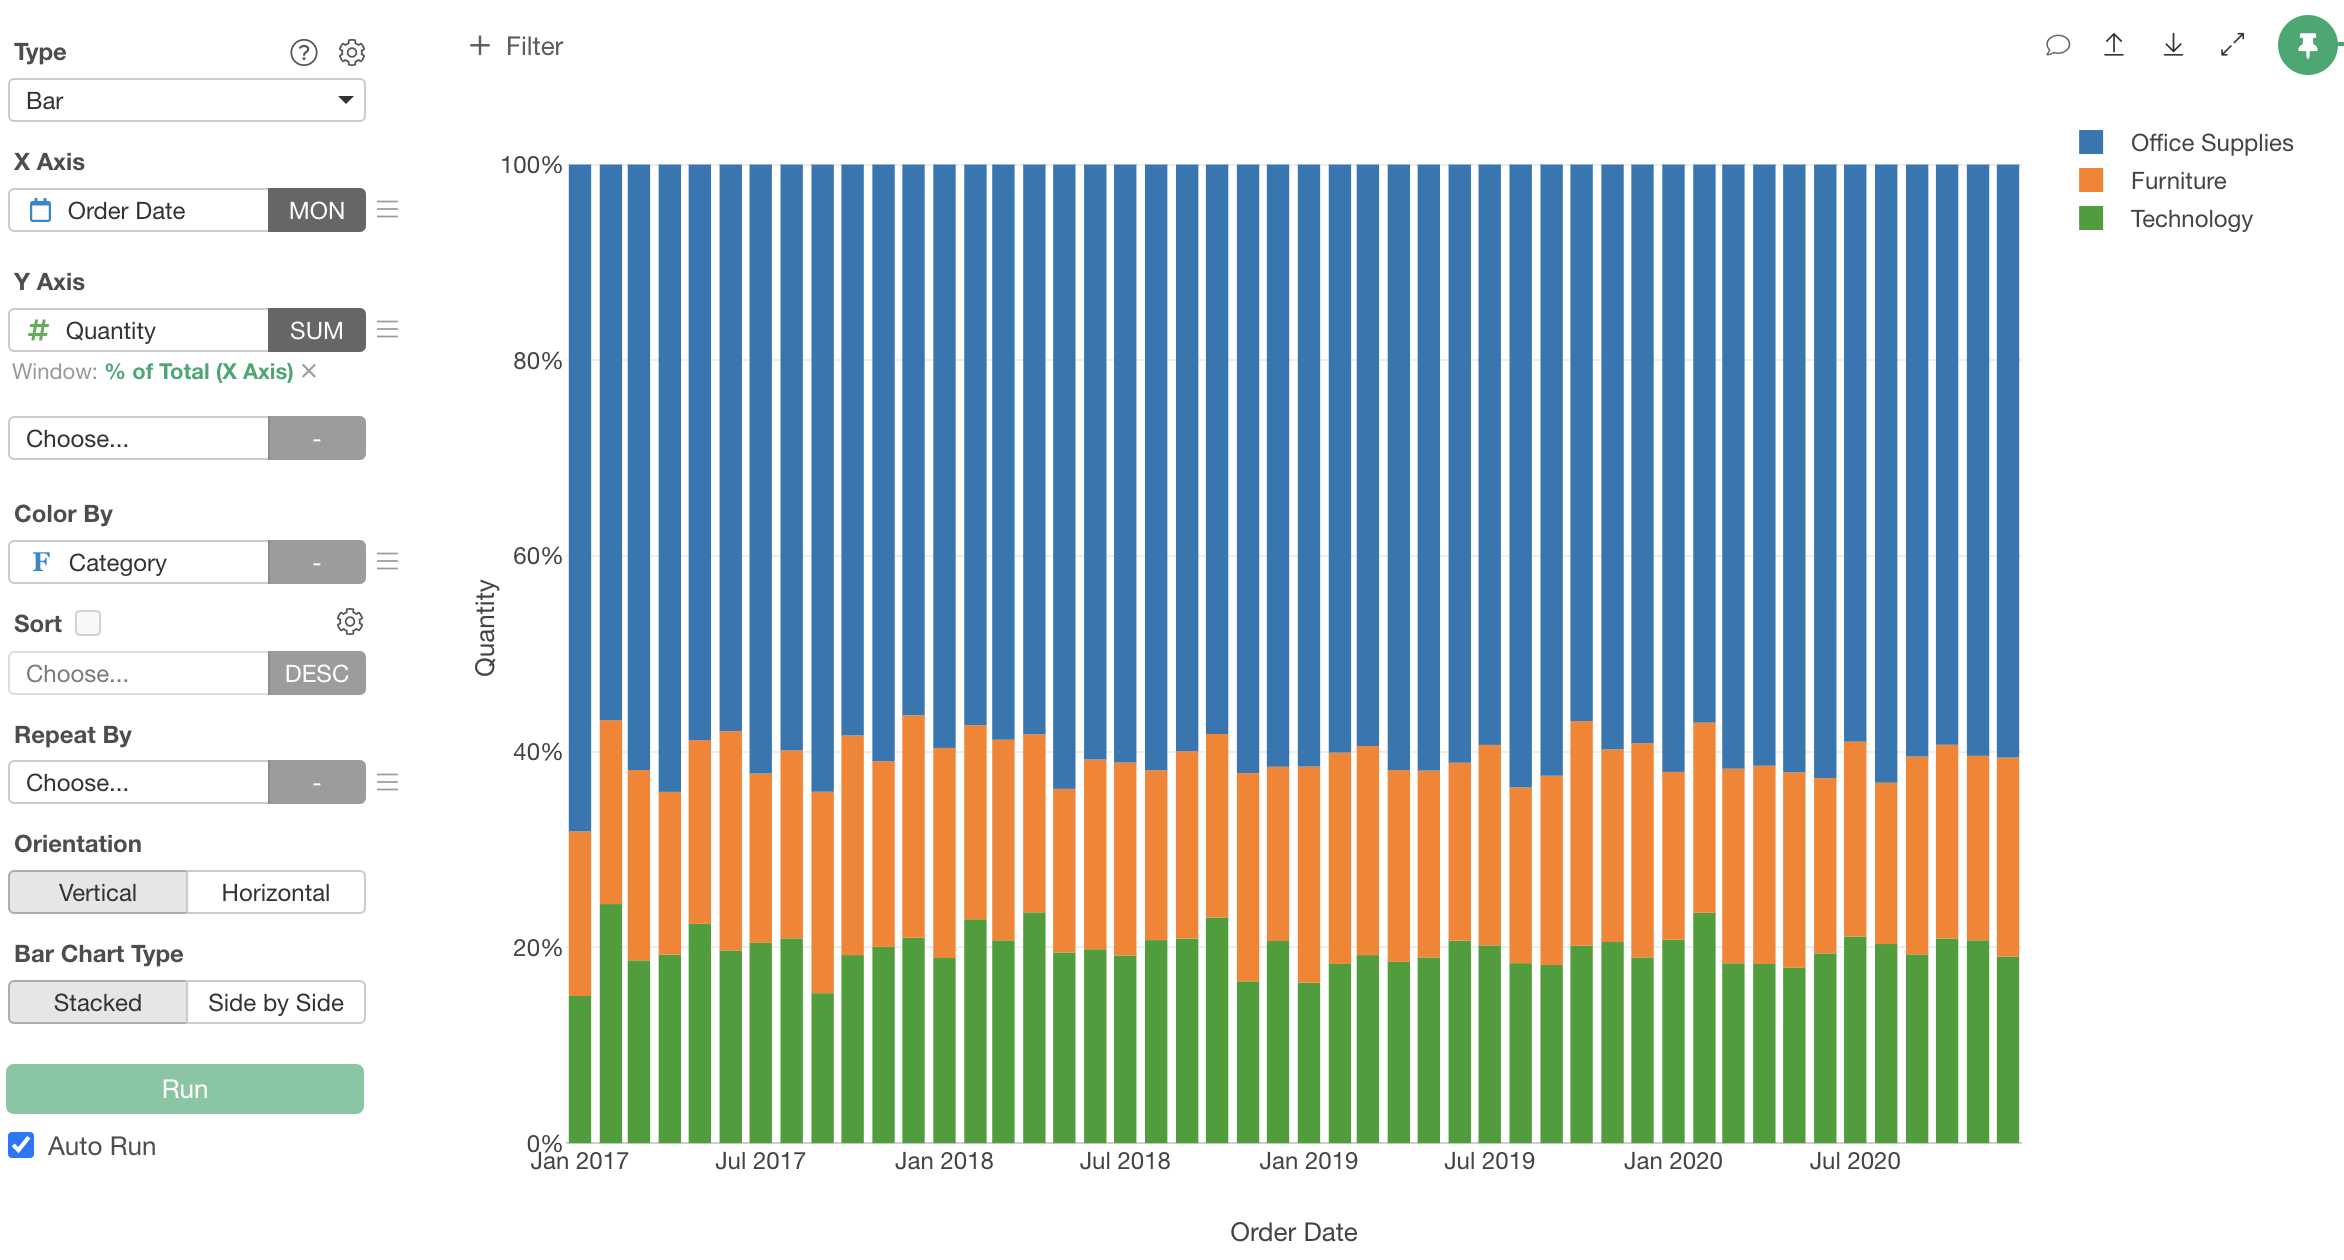
When visualizing data with colors to segment charts, sometimes the color order may differ even when assigning the same column.
In this Note, We’ll introduce two methods to normalize chart colors.
1. Set Colors by Display Name Order
You can maintain consistent colors by sorting based on the display name of the column assigned to colors, with some exceptions (e.g., when new values are added).
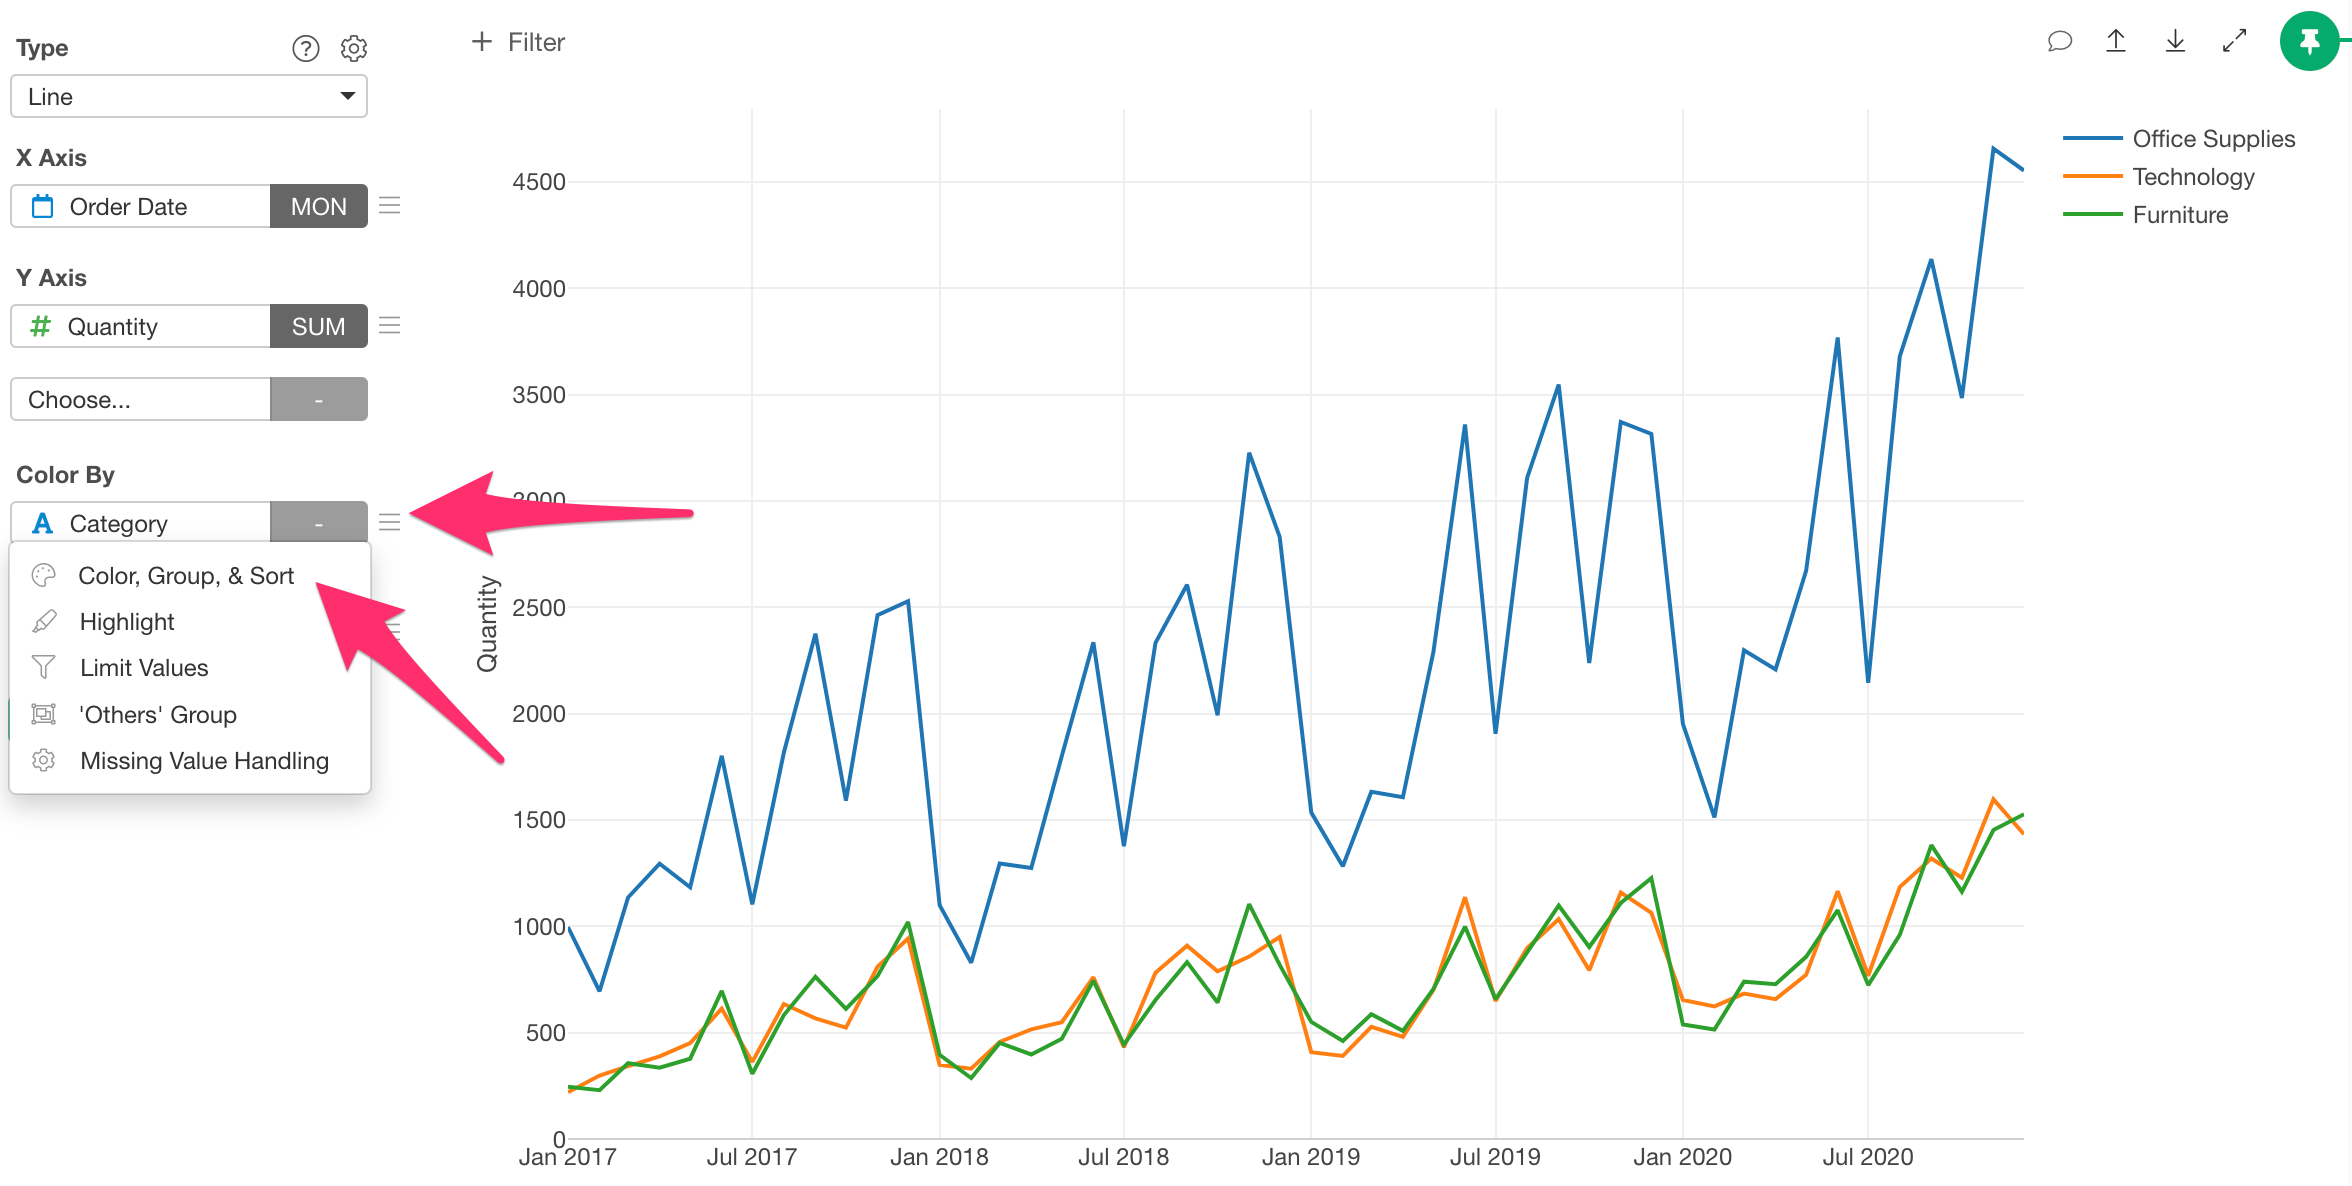
Select “Color, Group & Sort” from the color menu.
In the Color, Group, & Sort Setting dialog, select “Display Name” for the sort order.
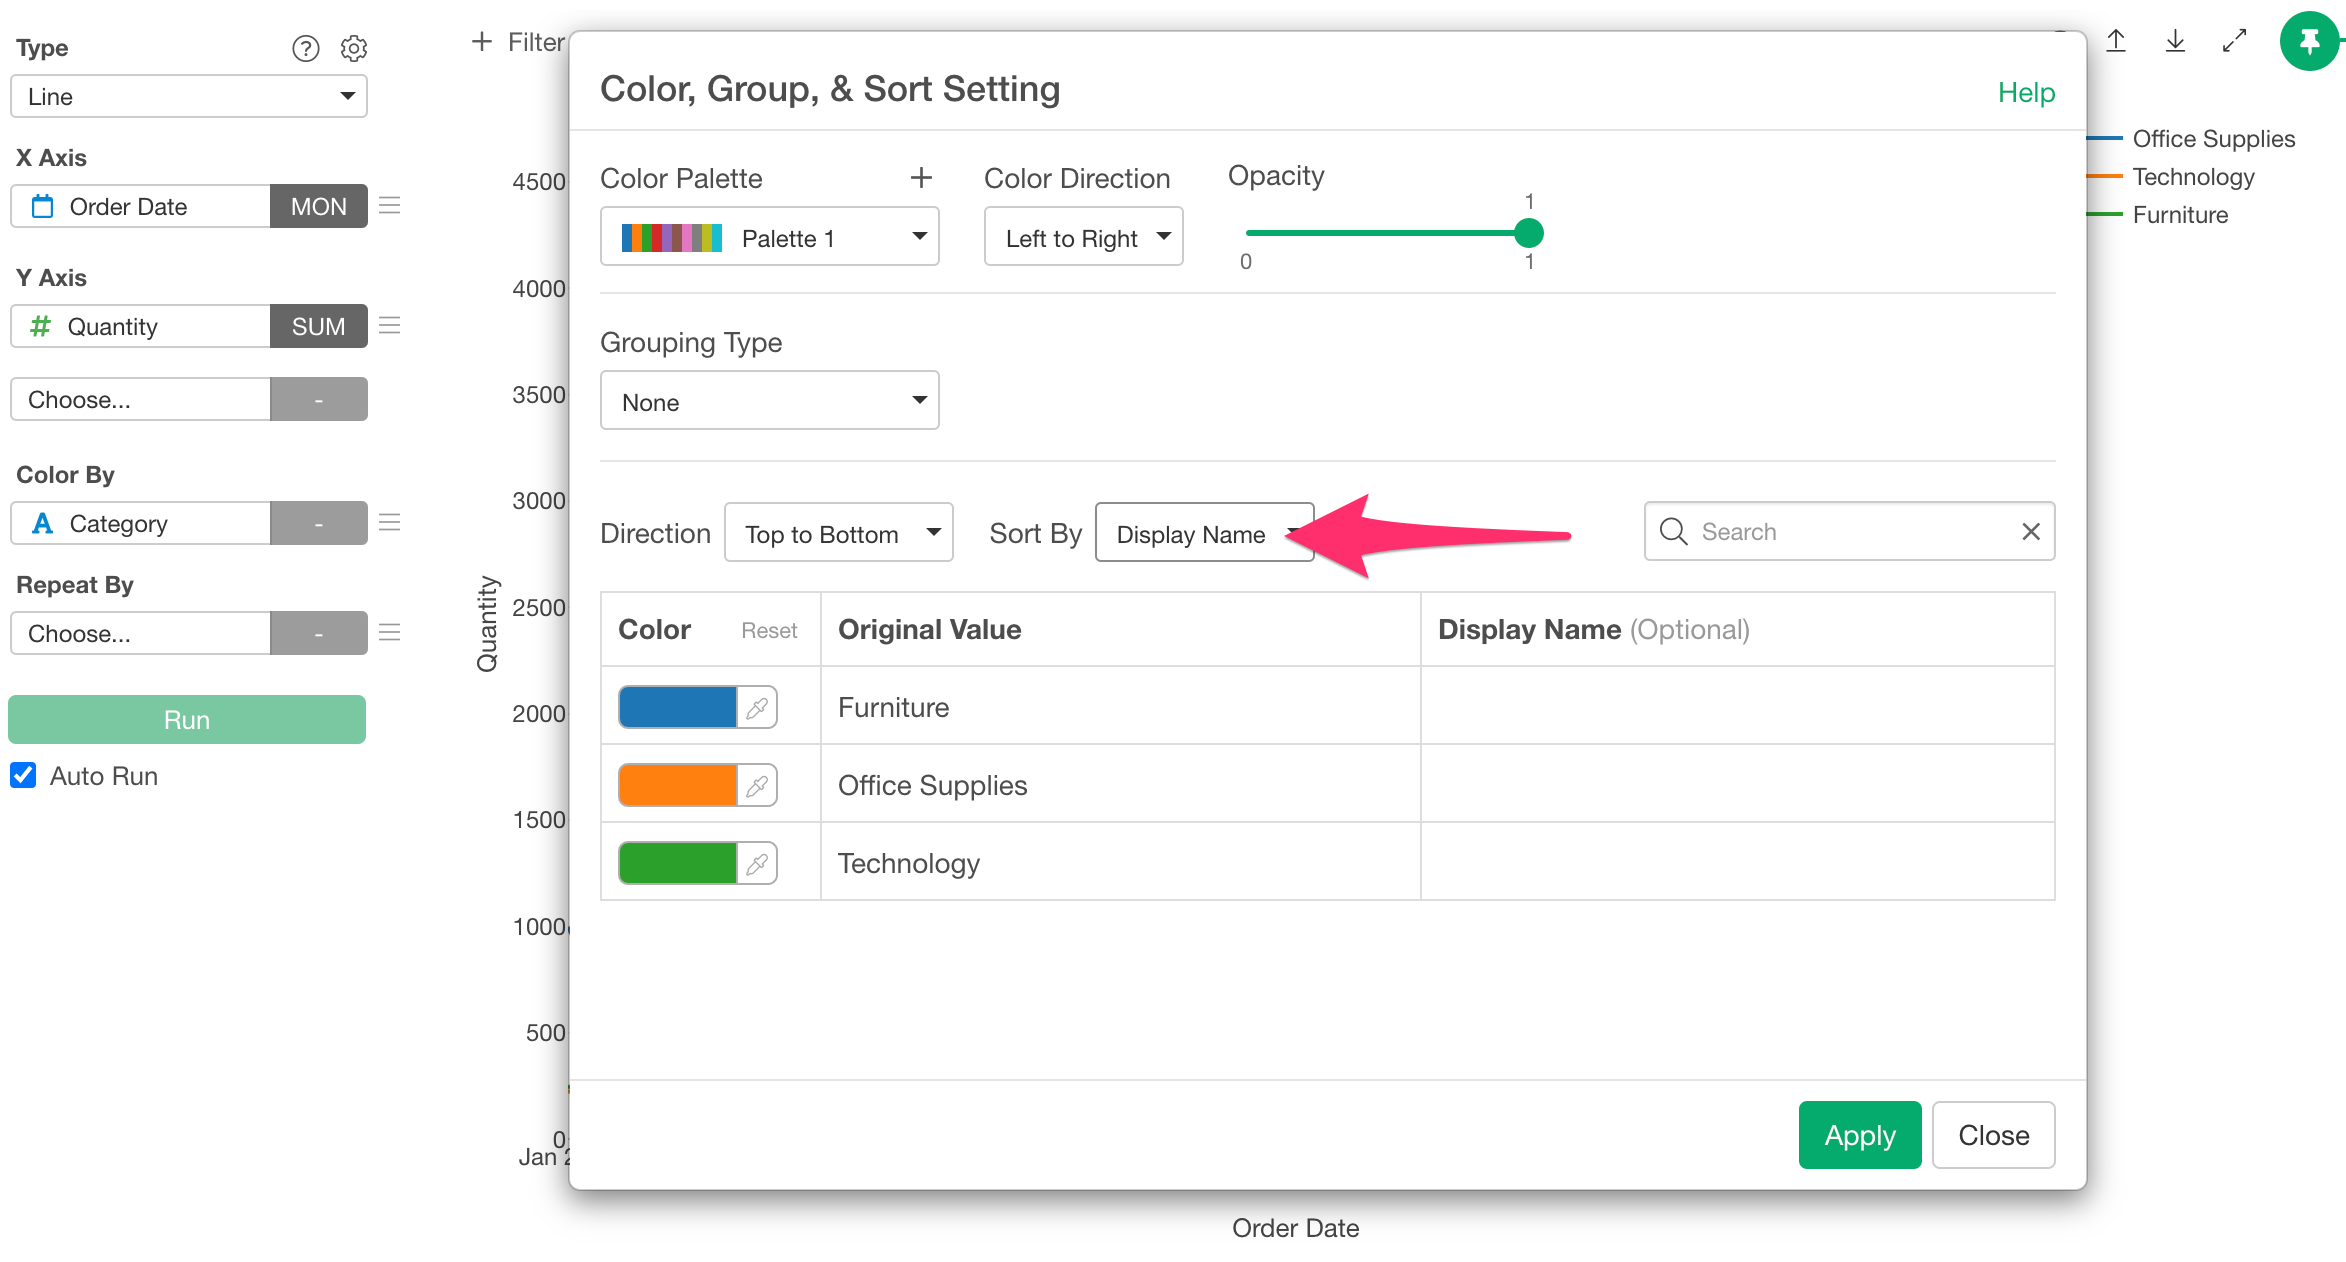
This allows visualization by display name order, ensuring color consistency when assigning the same column to colors in different charts.
2. Specify Custom Color Order
Another approach is to use a custom order rather than display name order.
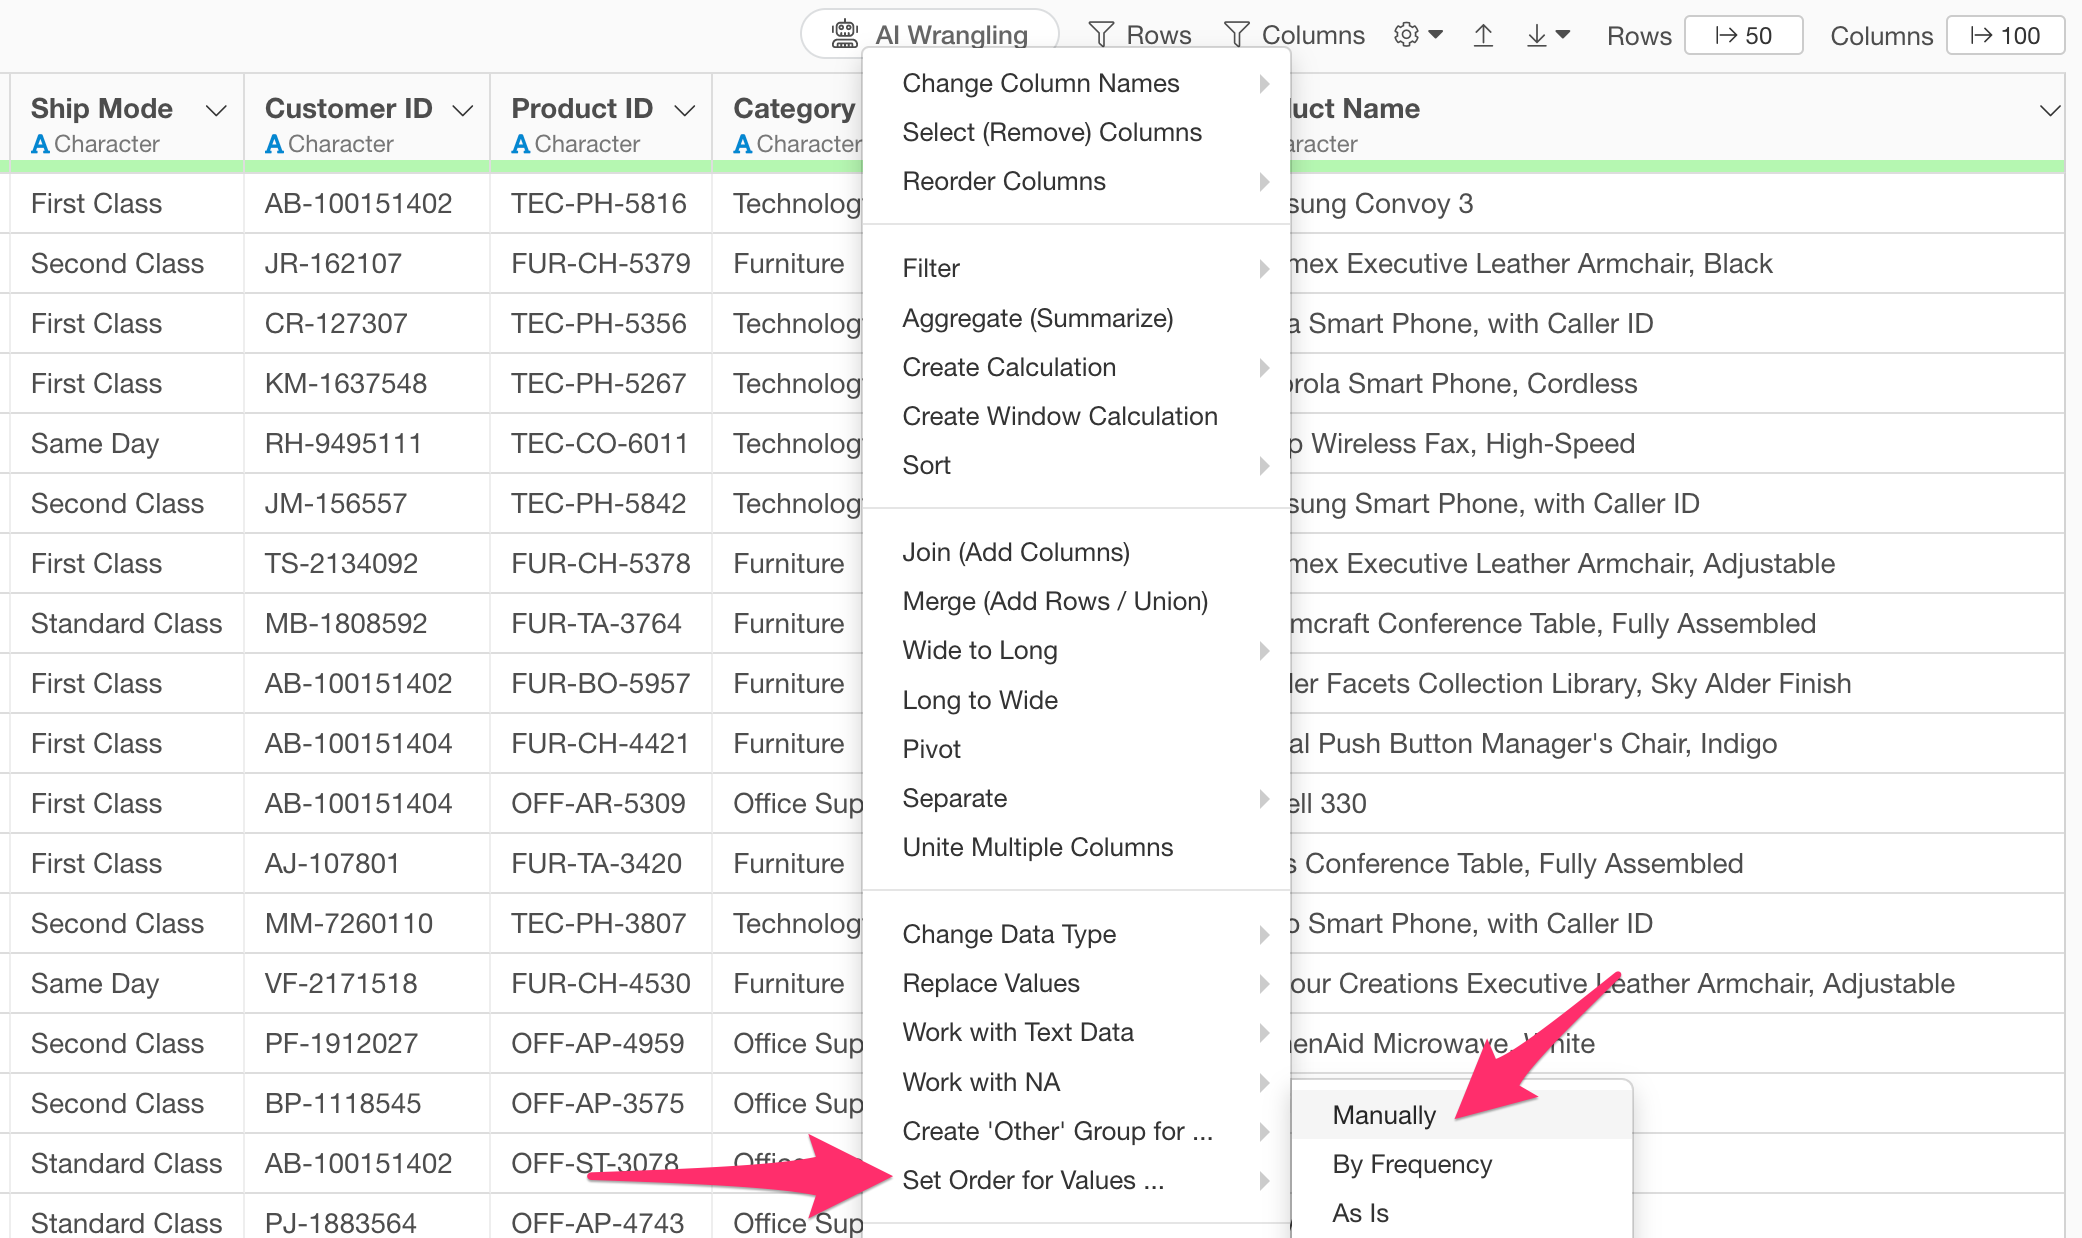
For example, suppose you wanted to set colors for the Category used in the previous example in an order different from alphabetical (e.g., Office Supplies, Furniture, Technology).
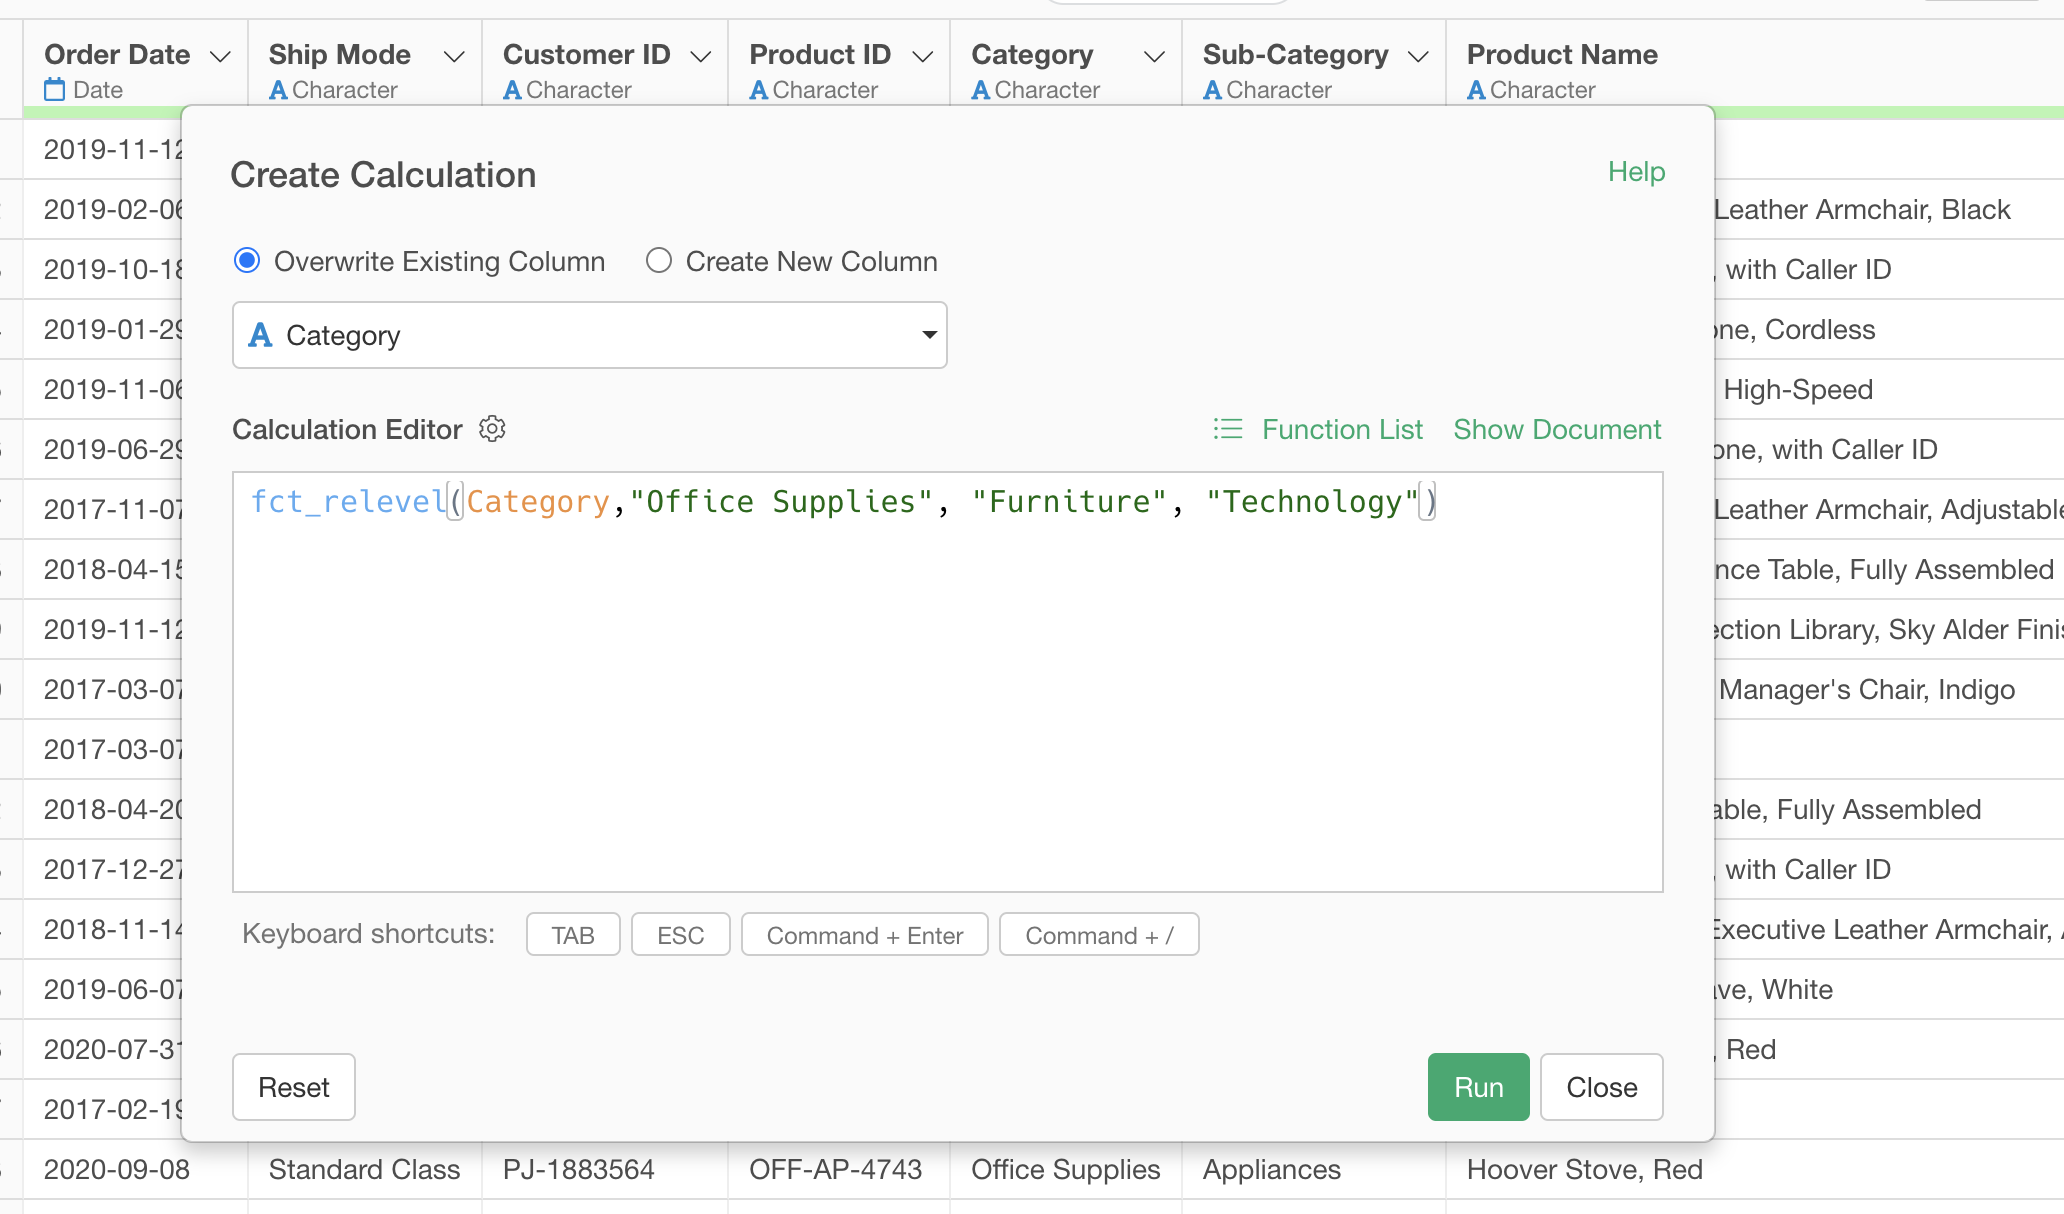
In such cases, from the Category column header menu, select “Set Order for Values”, “Manually.”
The fct_relevel function in the calculation editor is
used to set the order manually.
In this dialog, you can set the category order from lowest to highest level. In this case, we’re setting the order for the “Category” column as “Office Supplies”, “Furniture” and “Technology”.
his allows you to visualize the category in the order “Office Supplies”, “Furniture” and “Technology”.
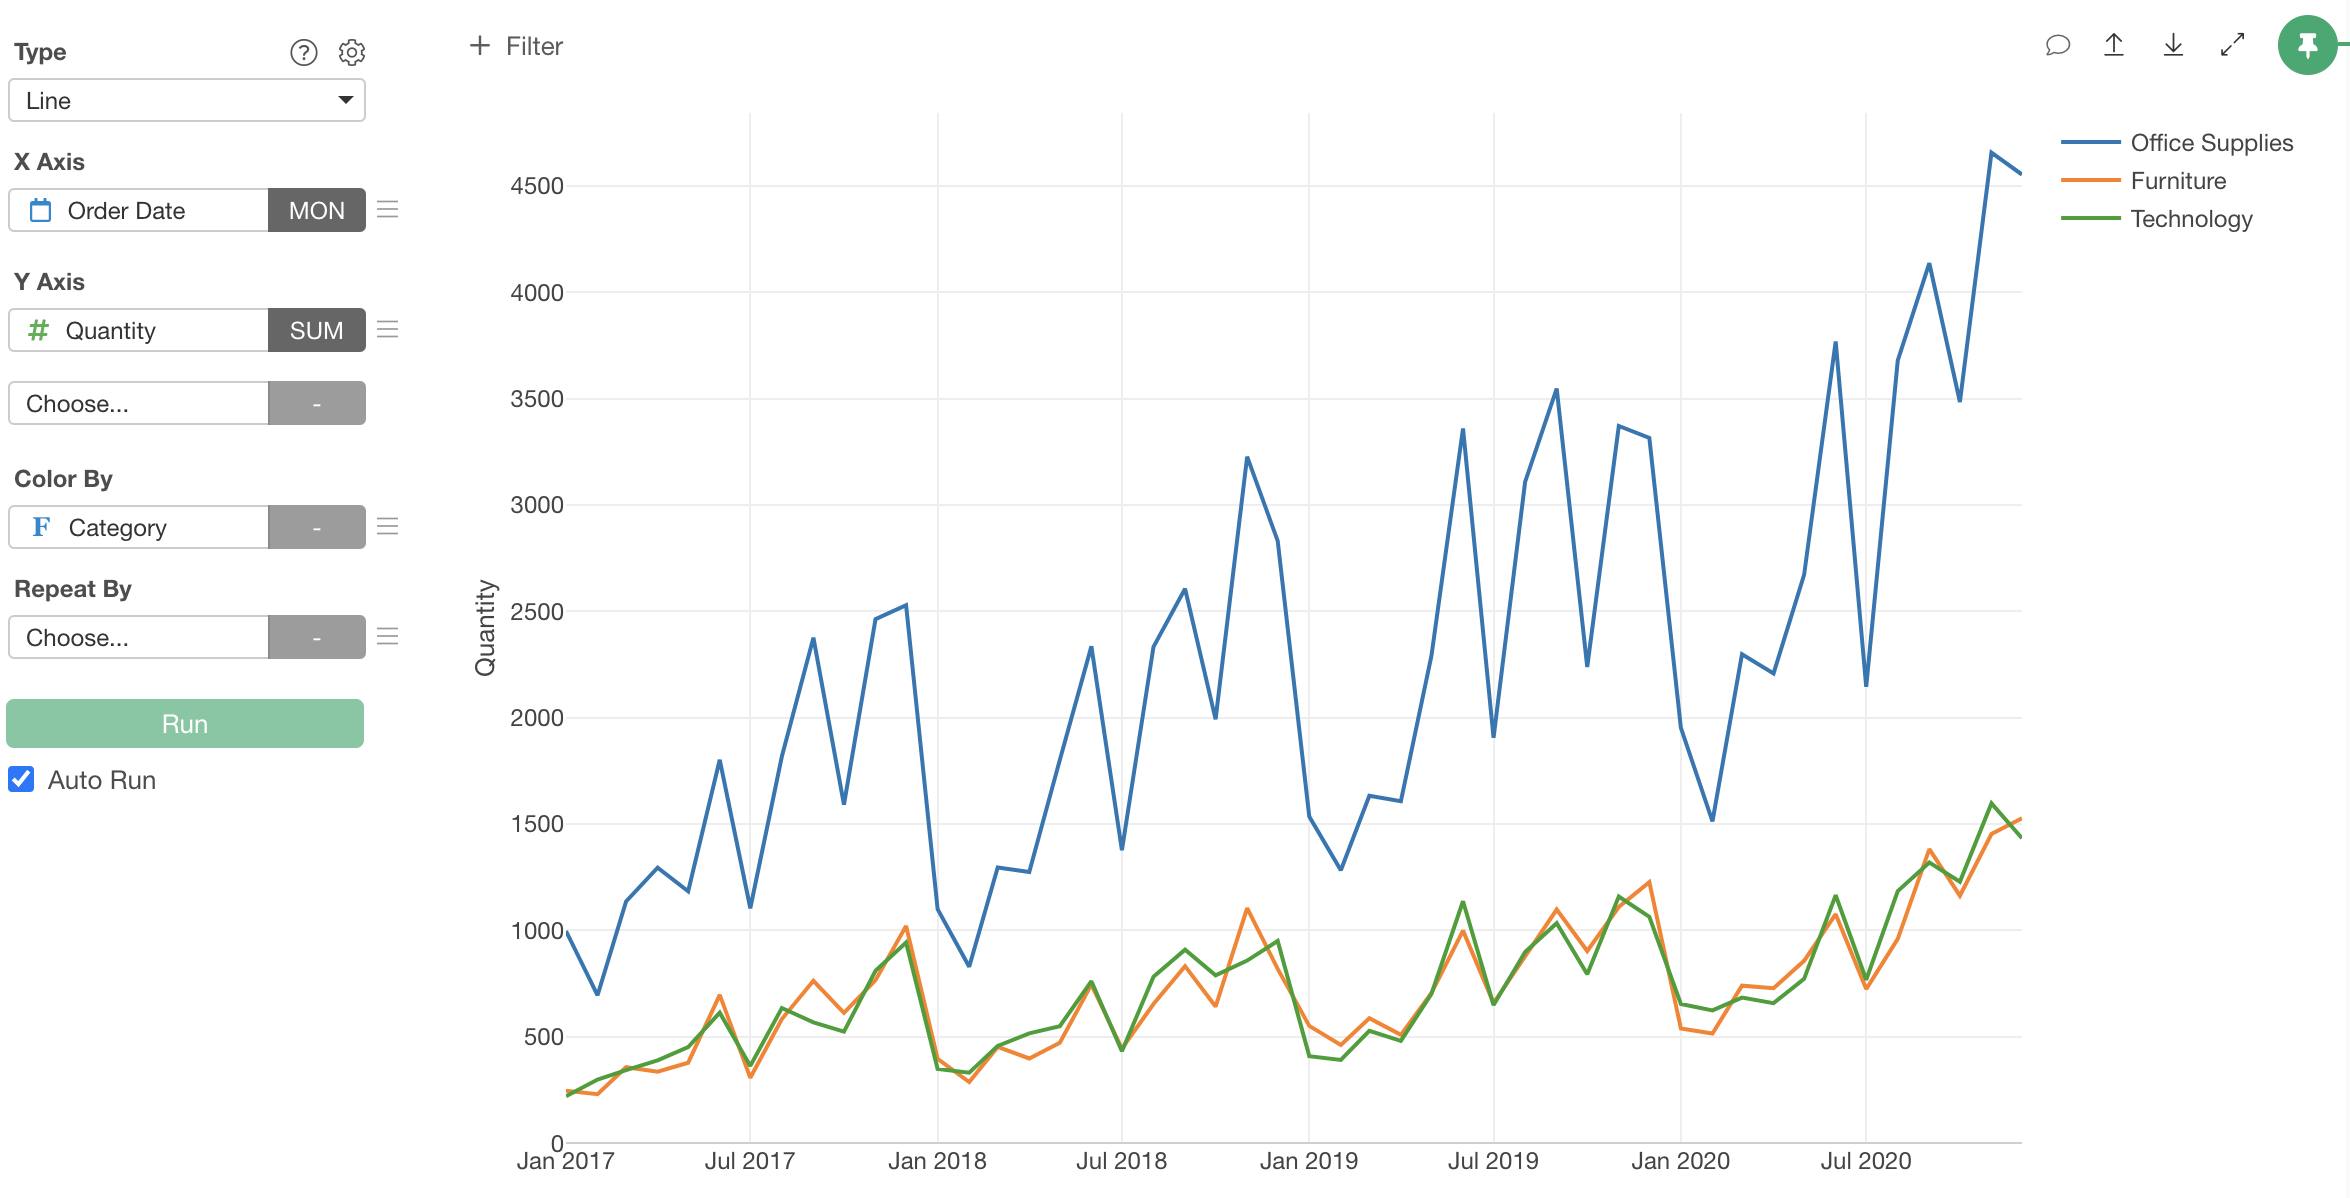
When assigning the category to colors in other charts, it will maintain the same order.