Introduction to Heatmap
Heatmap chart is often used to visualize which value combinations of two categorical columns are more frequent or have higher numbers.
Here's a quick introduction on how you can use Heatmap chart in Exploratory.
Sample Data
We'll use this Flight Delay data. You can download it from this page.
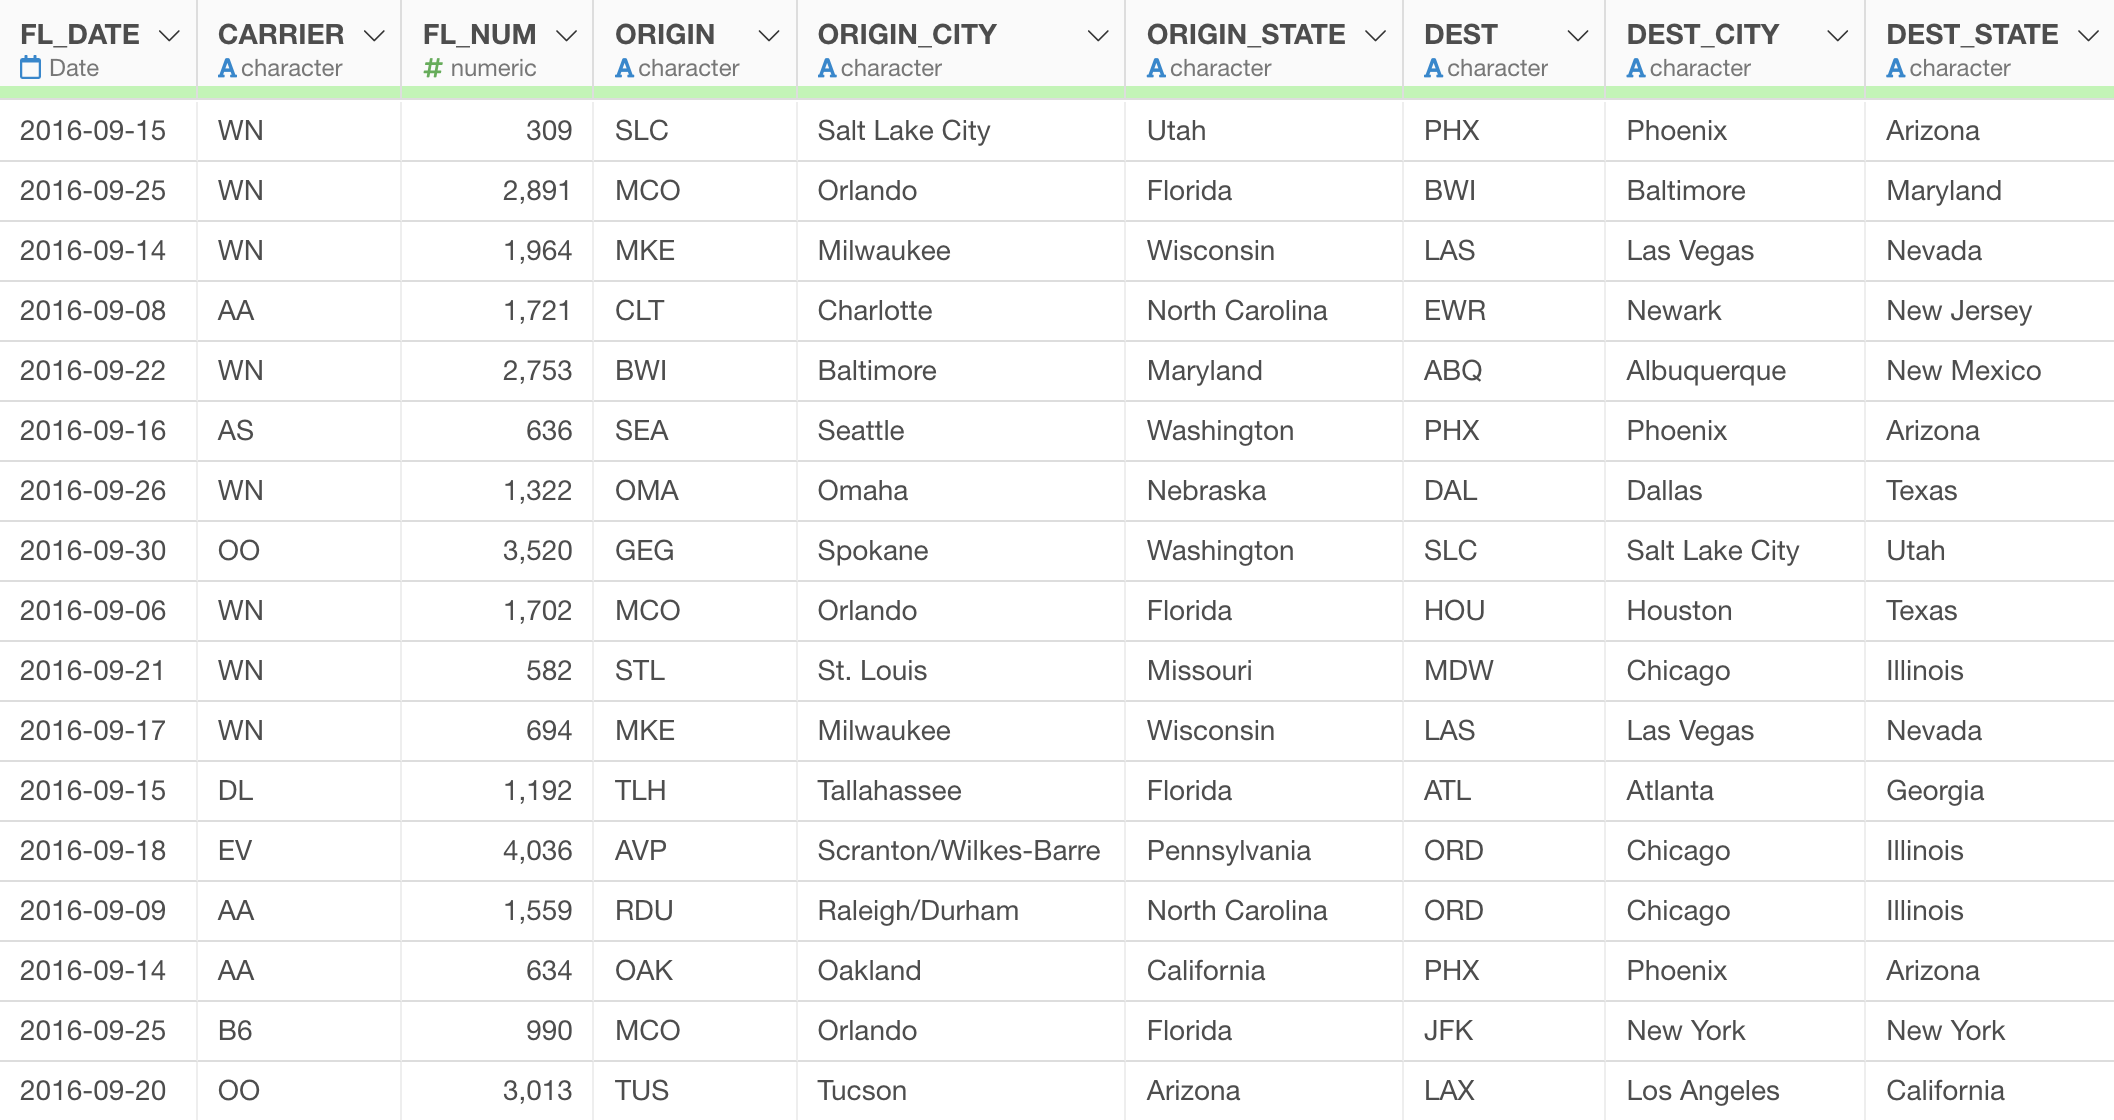
In this data, each row represents each flight that departed one airport and arrived another airport. It has the delay times for both departure and arrival of each flight.
1. Heatmap Basic
Let’s say, we want to see which day of the week and hour of the day have more flights leaving.
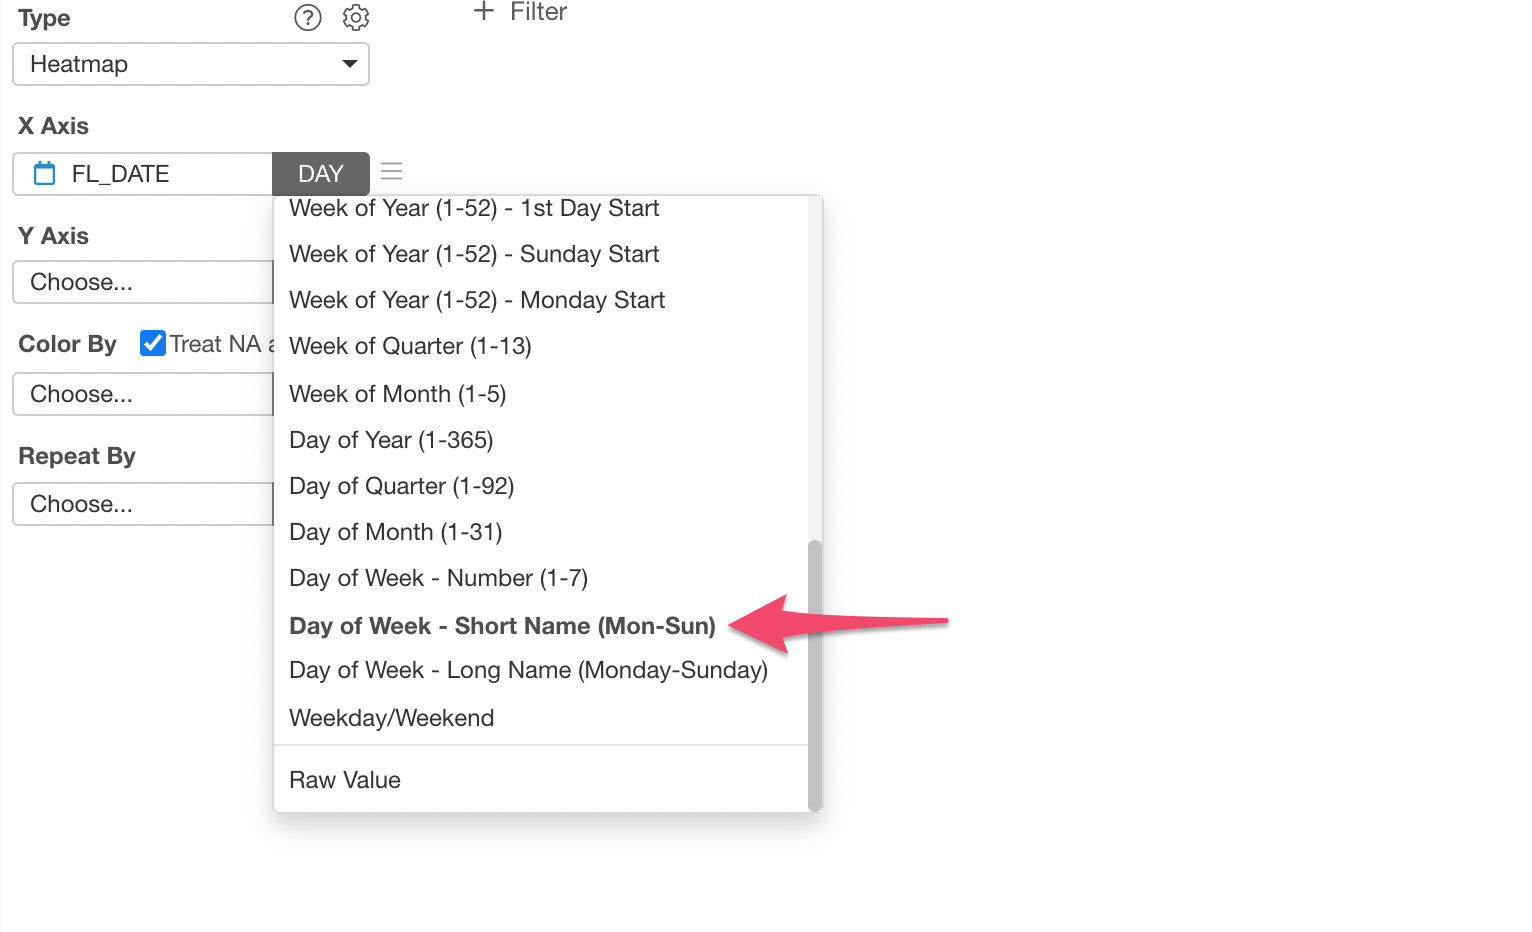
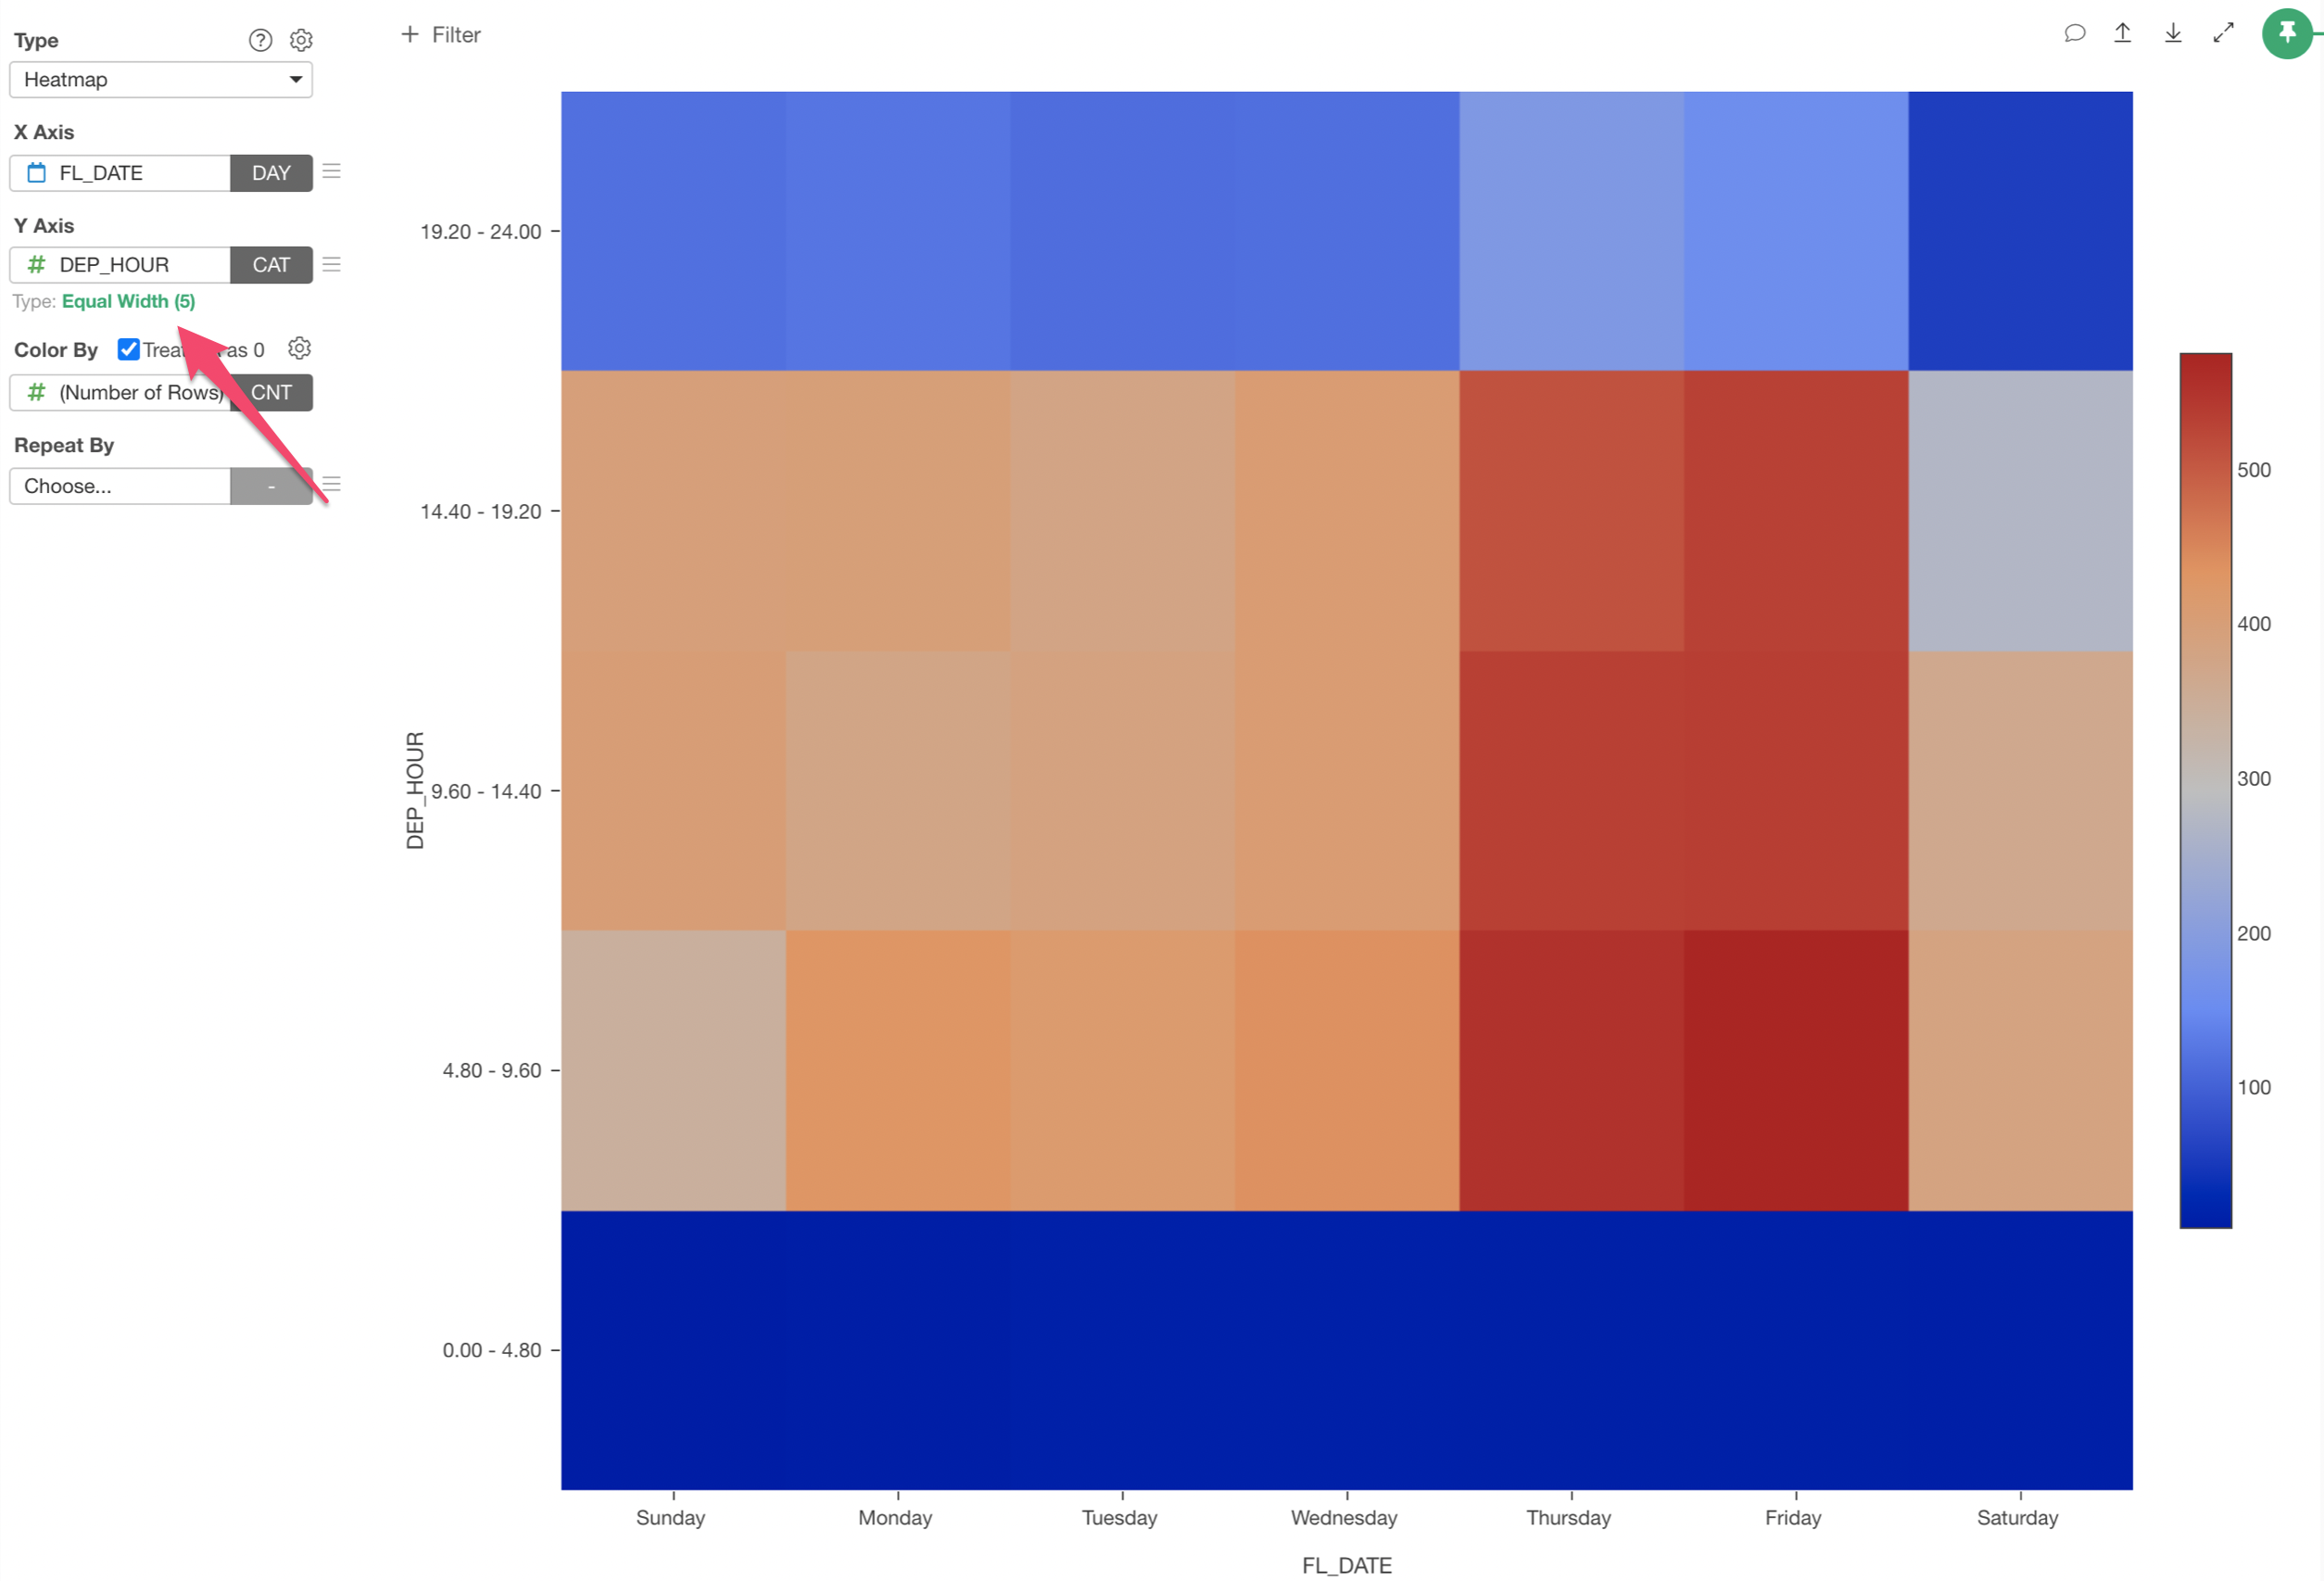
First, select 'FL_DATE' column to the X-Axis, and select 'Day of Week' for the aggregation level.
Then, select the 'DEP_HOUR' column to the Y-Axis.
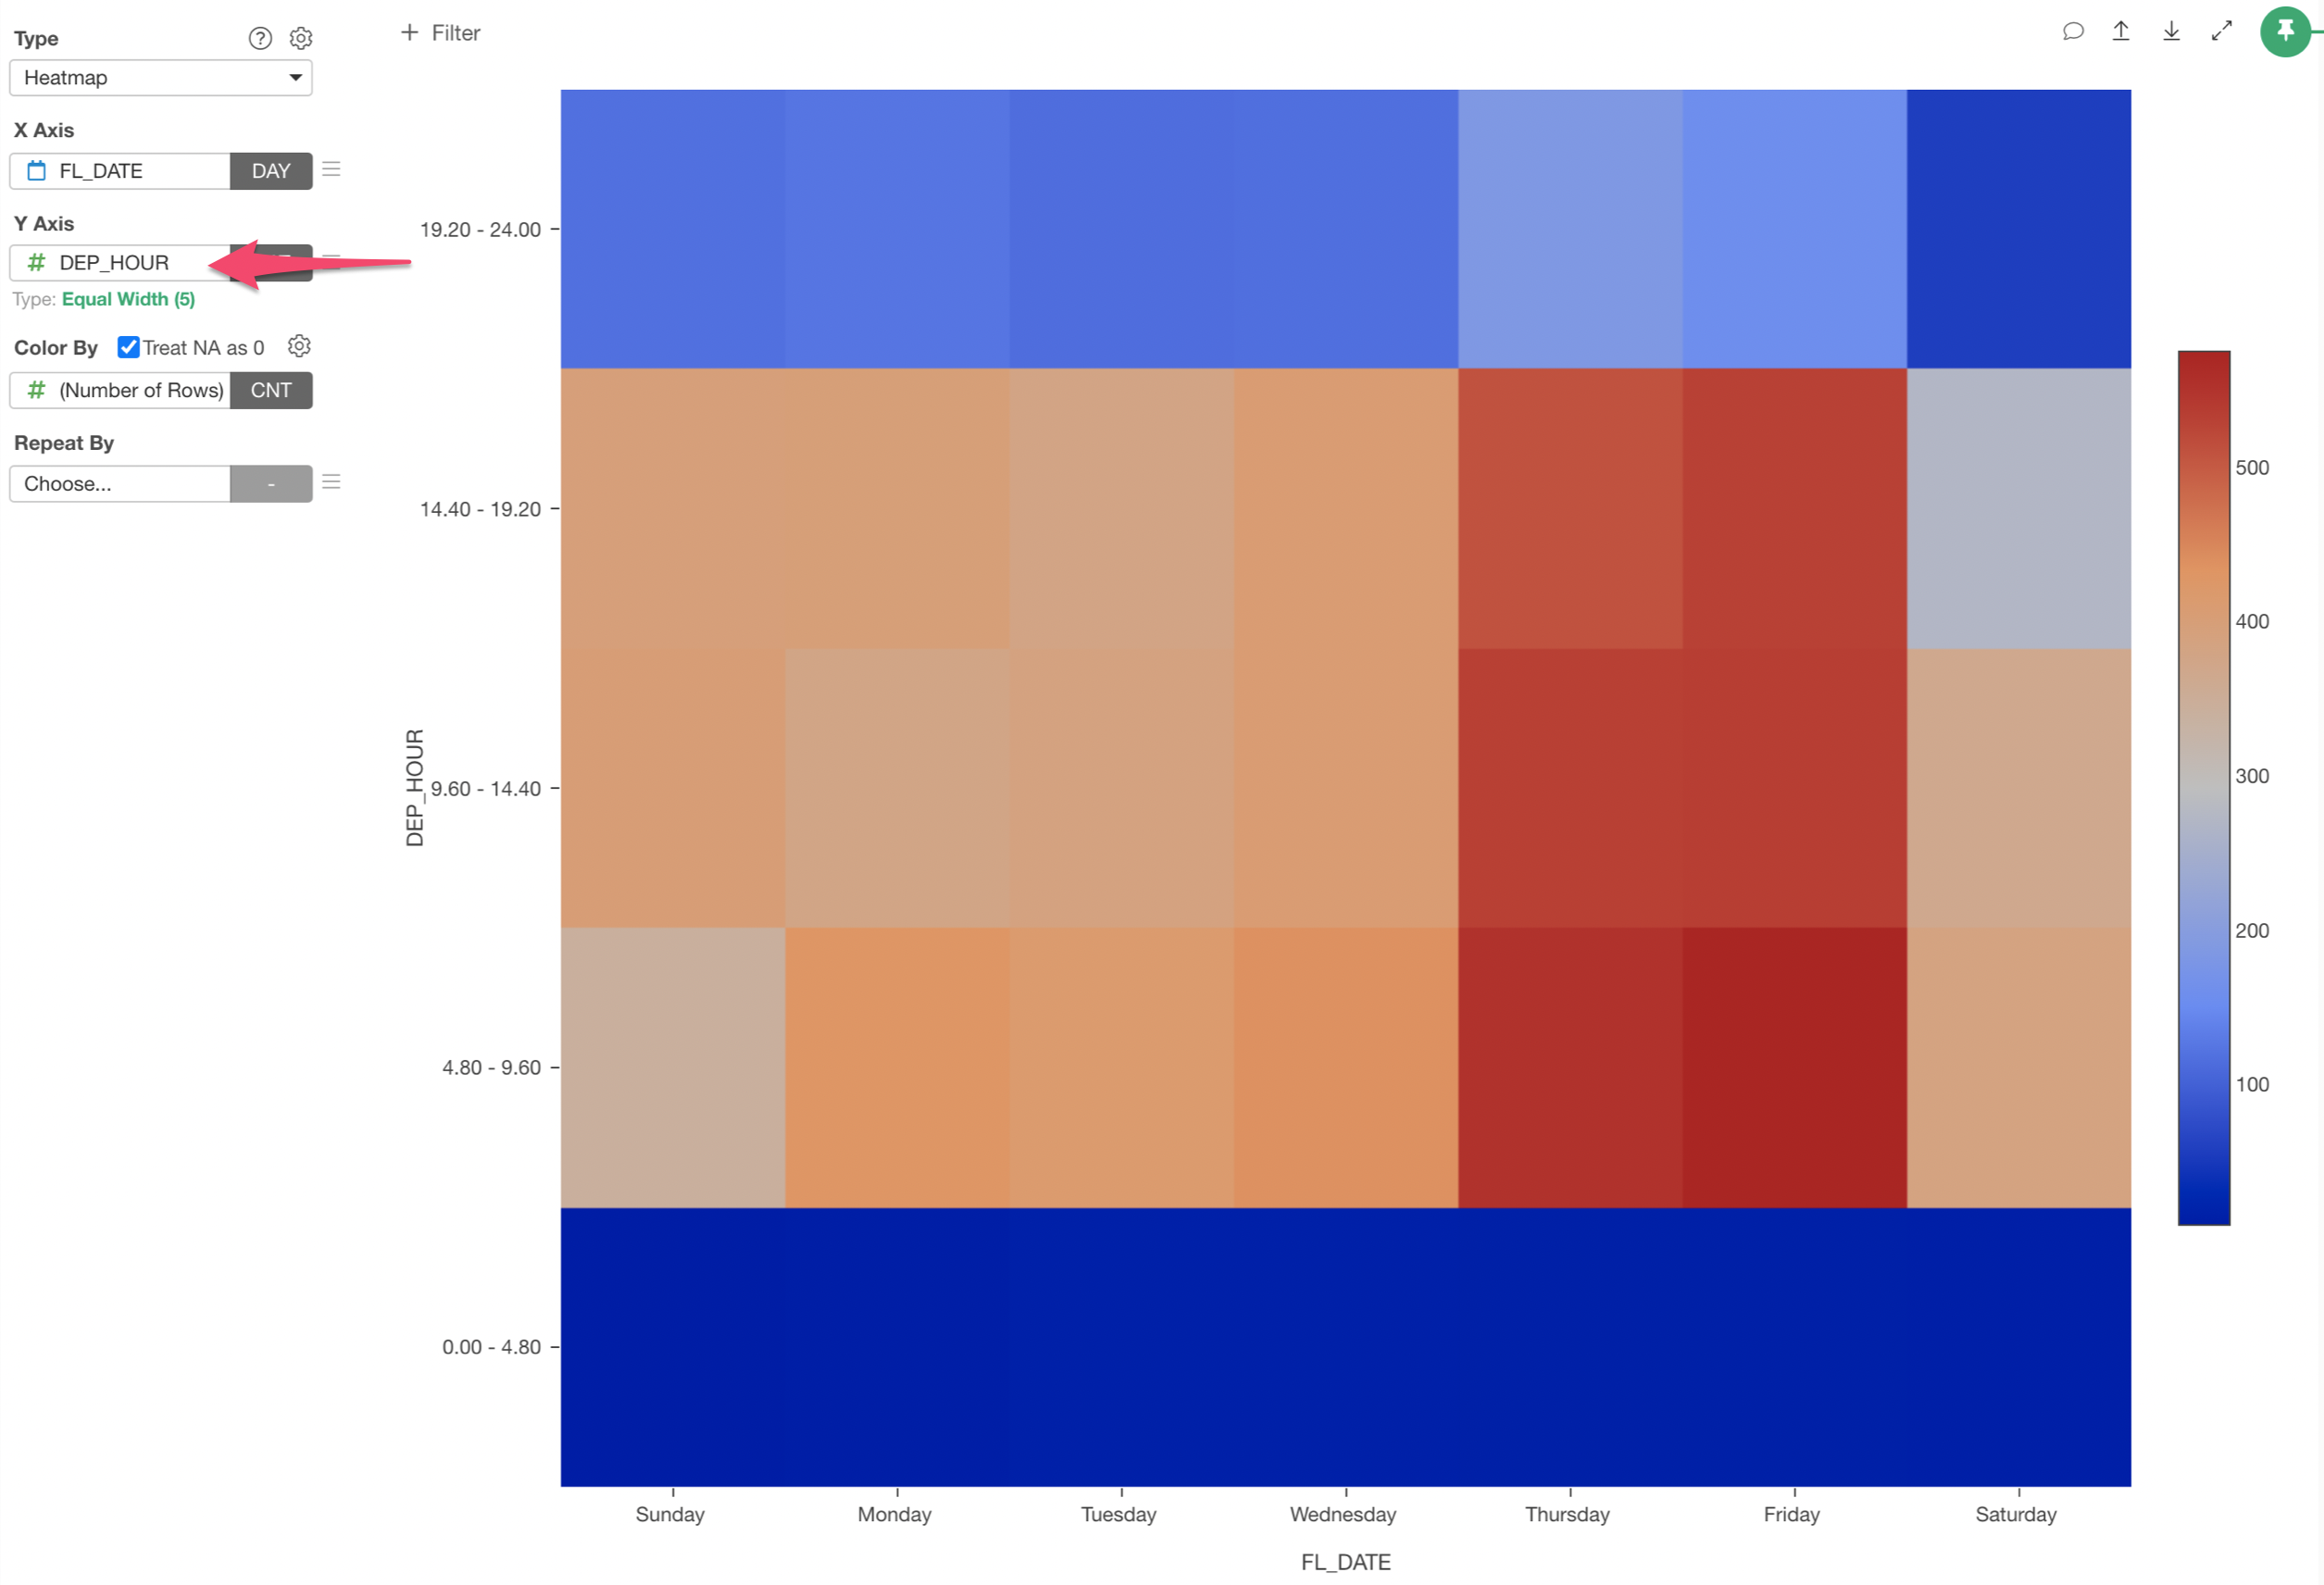
This will create 5 groups, each of which has a equal length of hours, rather than showing the original hour values. When you assign numerical columns to X-Axis or Y-Axis Exploratory automatically 'categorize' them by dividing the original values into 5 buckets (groups) with 'equal width' grouping option by default.
You can change the dividing option by clicking on the green text.
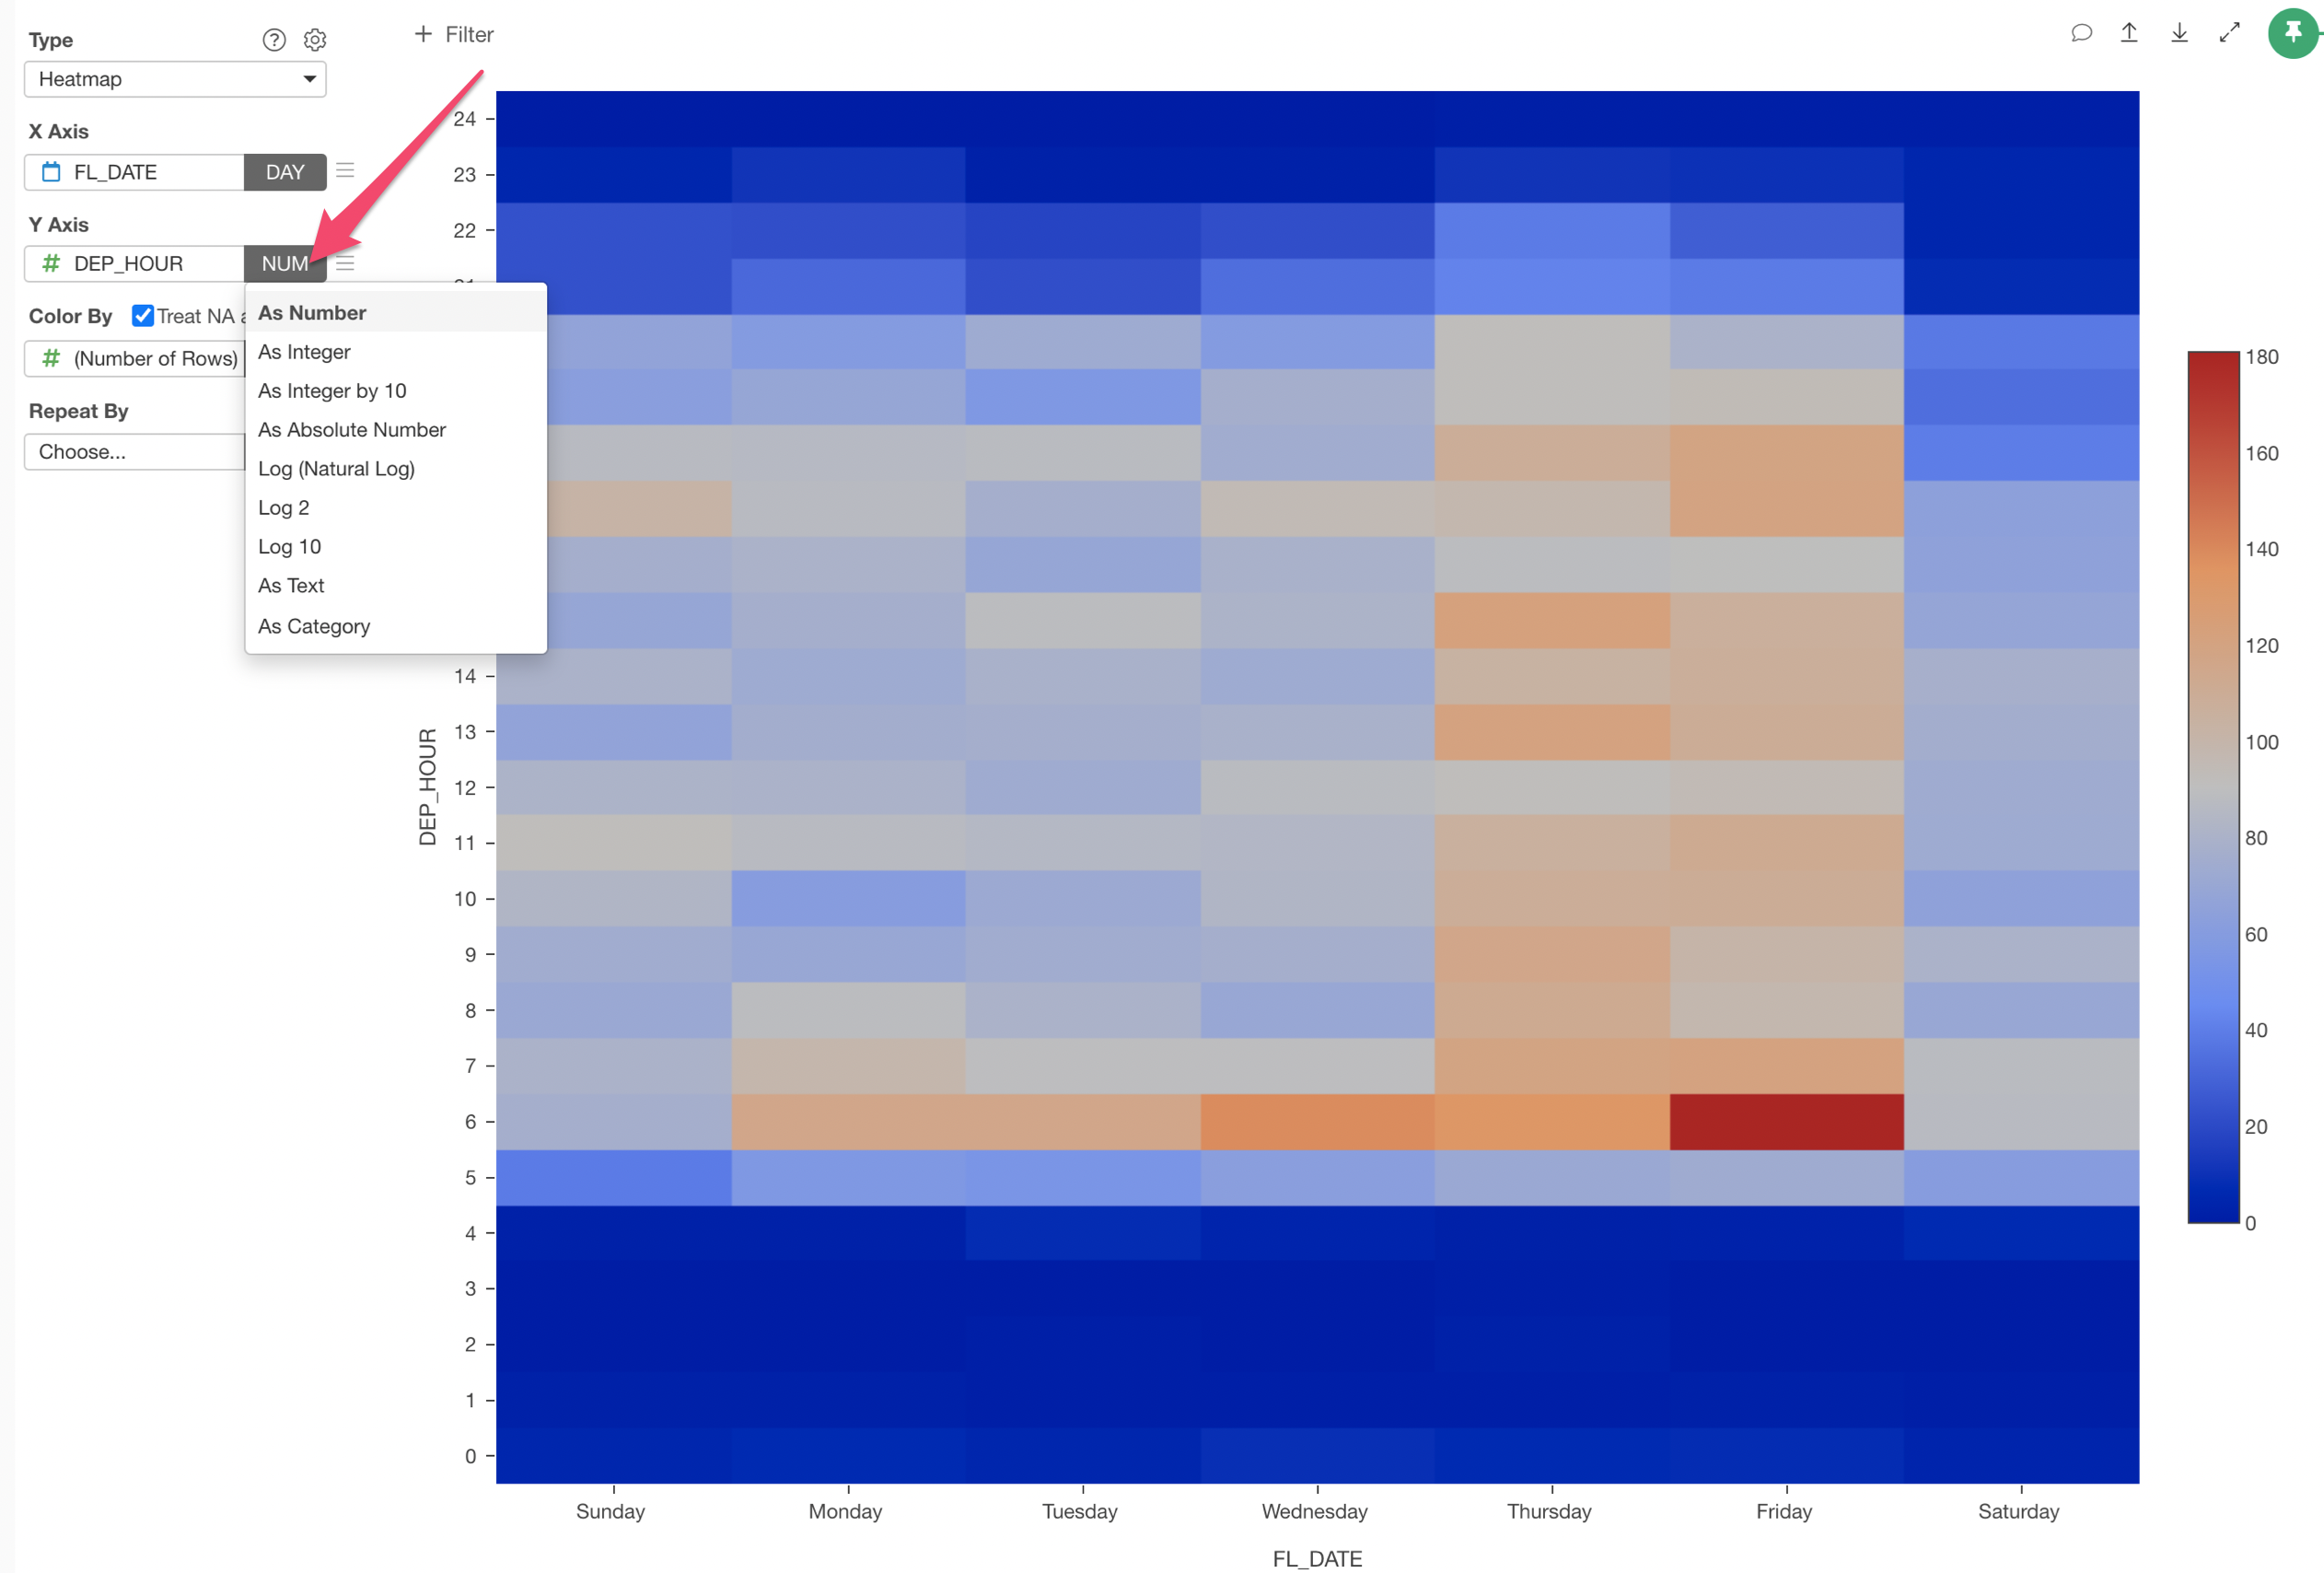
Or, you can simply show it as the original numeric values by selecting 'As Number' for the Y-Axis's aggregation level menu.
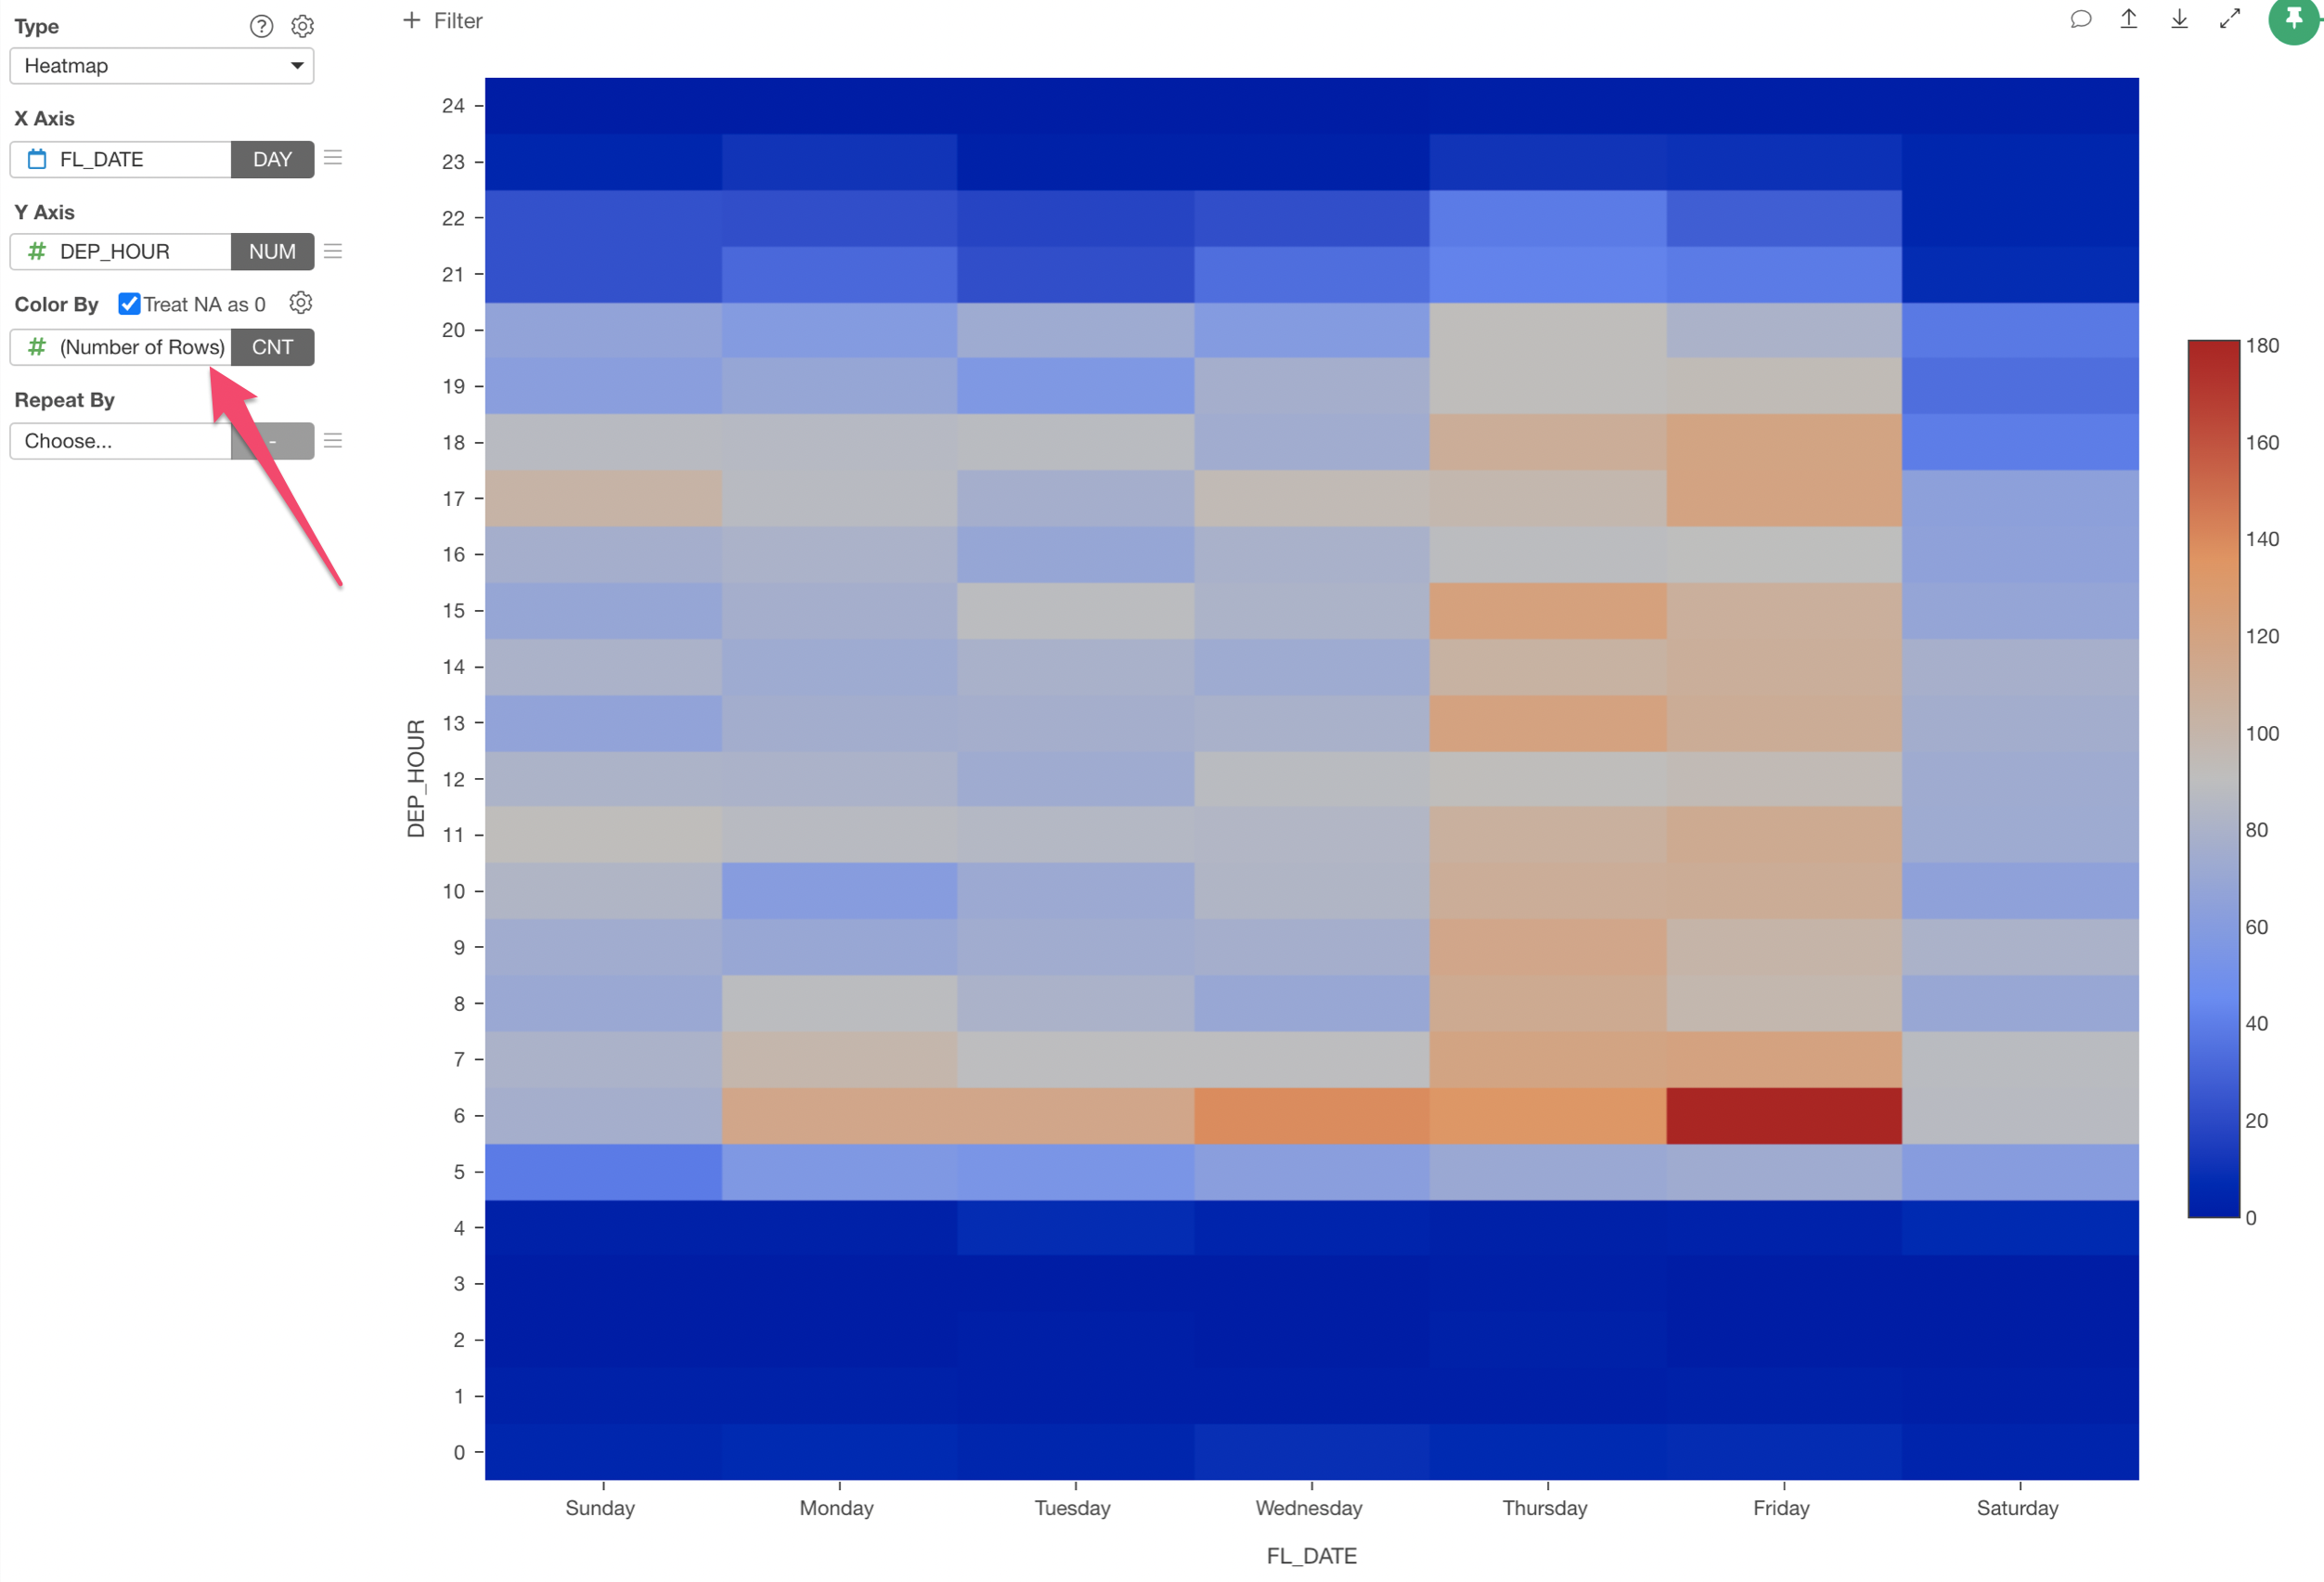
In this example, we'll keep the Value to be the default 'Number of Rows' because we wanted to show the number of flights for each section of the Day of Week and Hour.
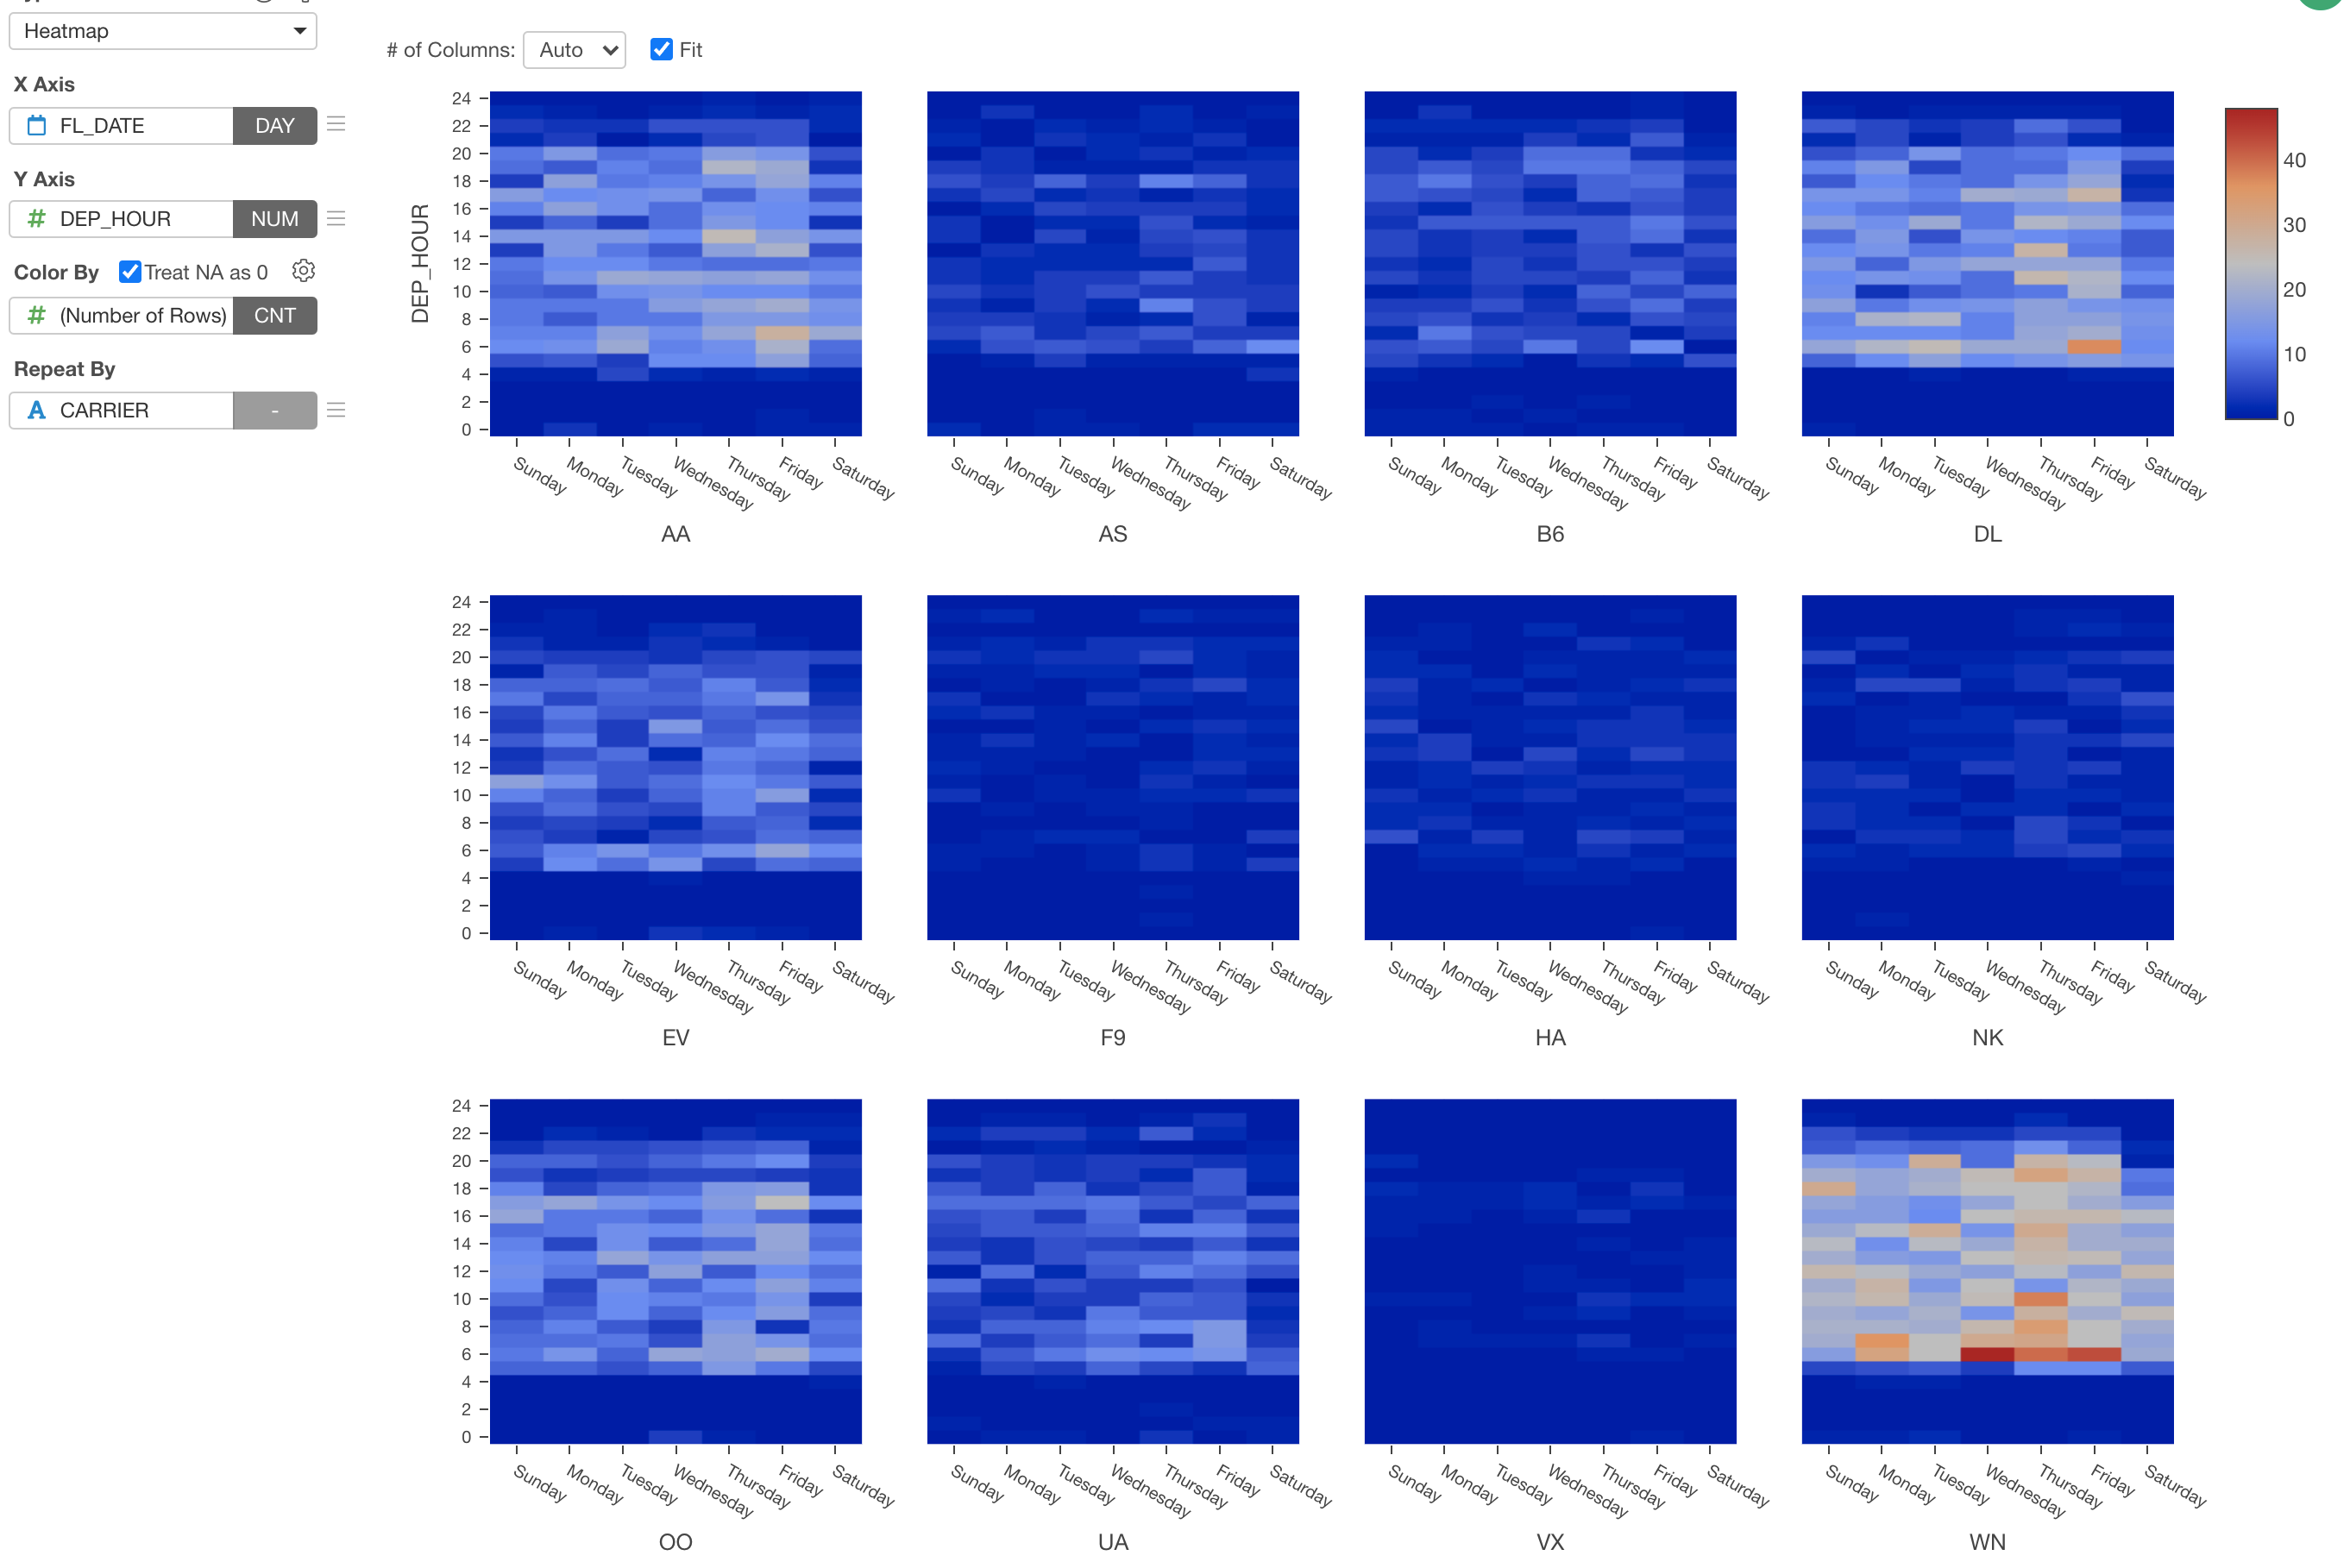
2. Repeat Heatmap
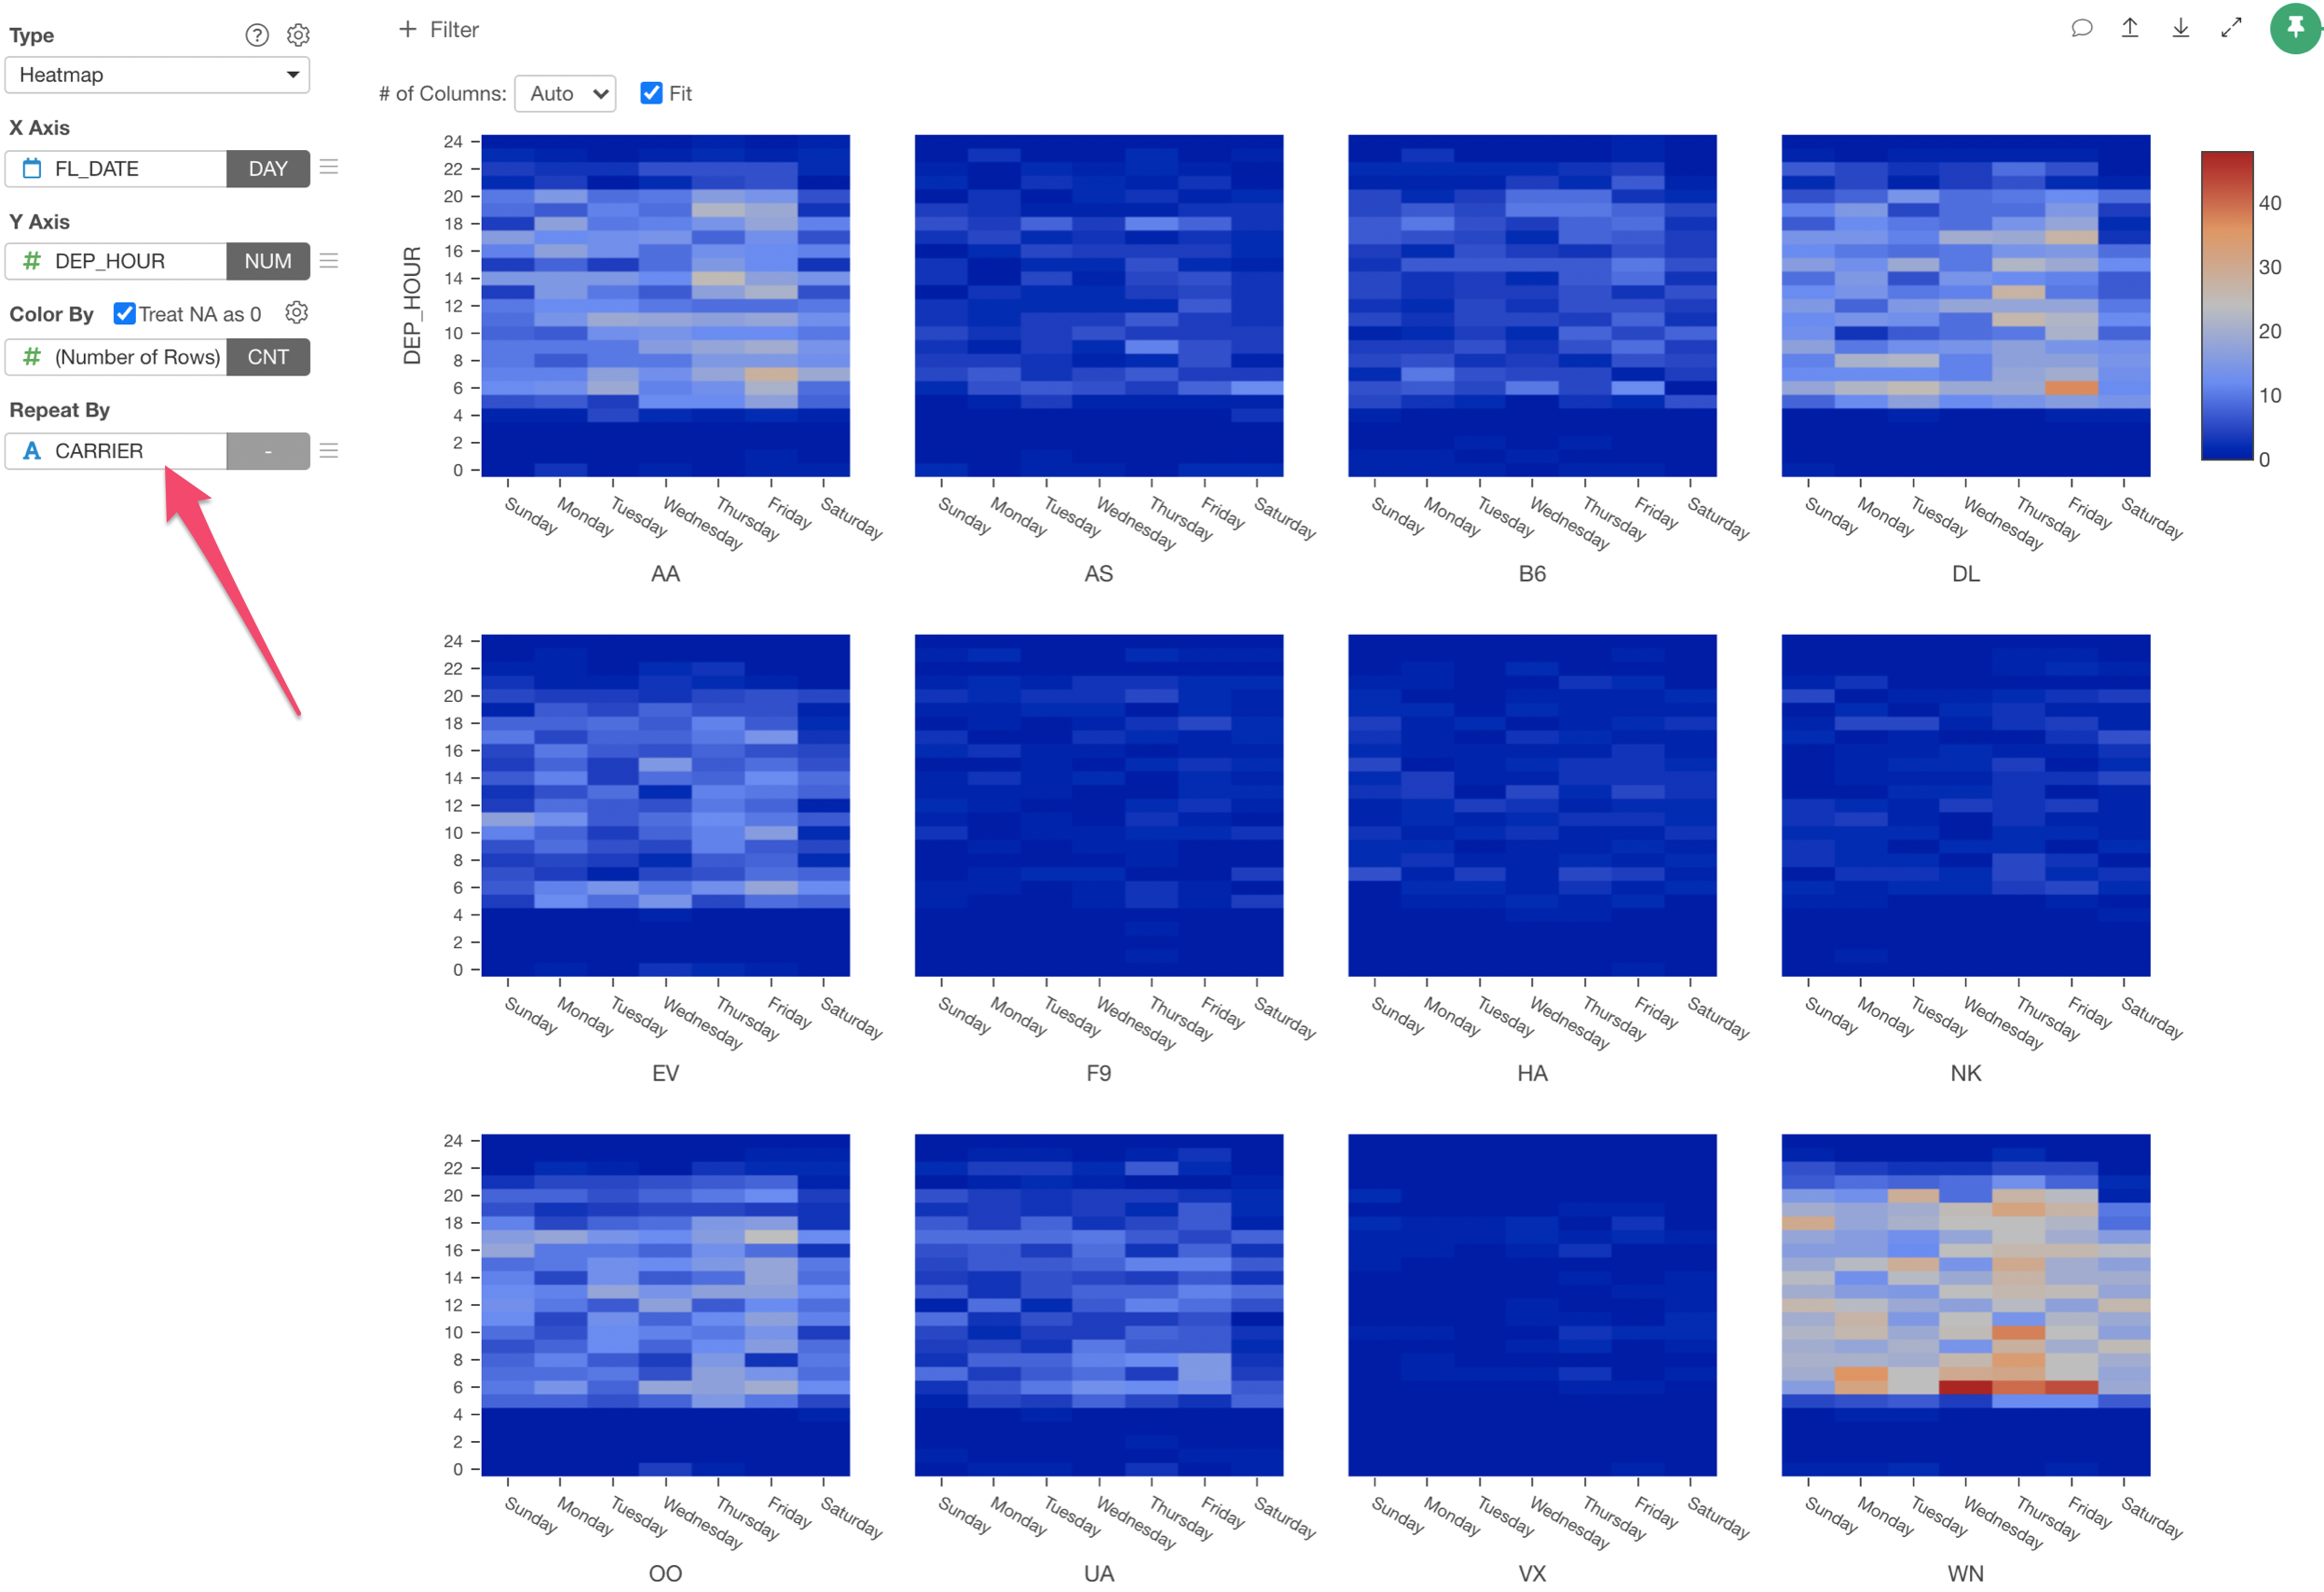
You can use 'Repeat By' to repeat the heatmap for each group.
For example, you might want to assign the 'CARRIER' to the Repeat By so that you can have multiple heatmap charts each of which is generated for each carrier.
Try it for yourself!
If you want to quickly try it out and you don’t have an Exploratory account yet, sign up from our website for 30 days free trial without a credit card!
If you happen to be a current student or teacher at schools, it’s free! Sign up for Community Plan.
And, if you don’t mind sharing what you create publicly you can sign up for Public edition of Exploratory (FREE)!