Time Series Forecasting with Prophet using Custom Holiday Data
In this note, as an example of time series forecasting with custom holiday data, I’m forecasting page views of Wikepedia article “Apple Worldwide Developers Conference”(WWDC), taking the effect of the days WWDC is actually held on.
If you don’t need custom holiday data for the forecast, and just regular national holidays are enough for your need of forecasting, this article might be of help.
Data
We will make a forecast based on daily page view data of the Wikipedia article that looks like this.
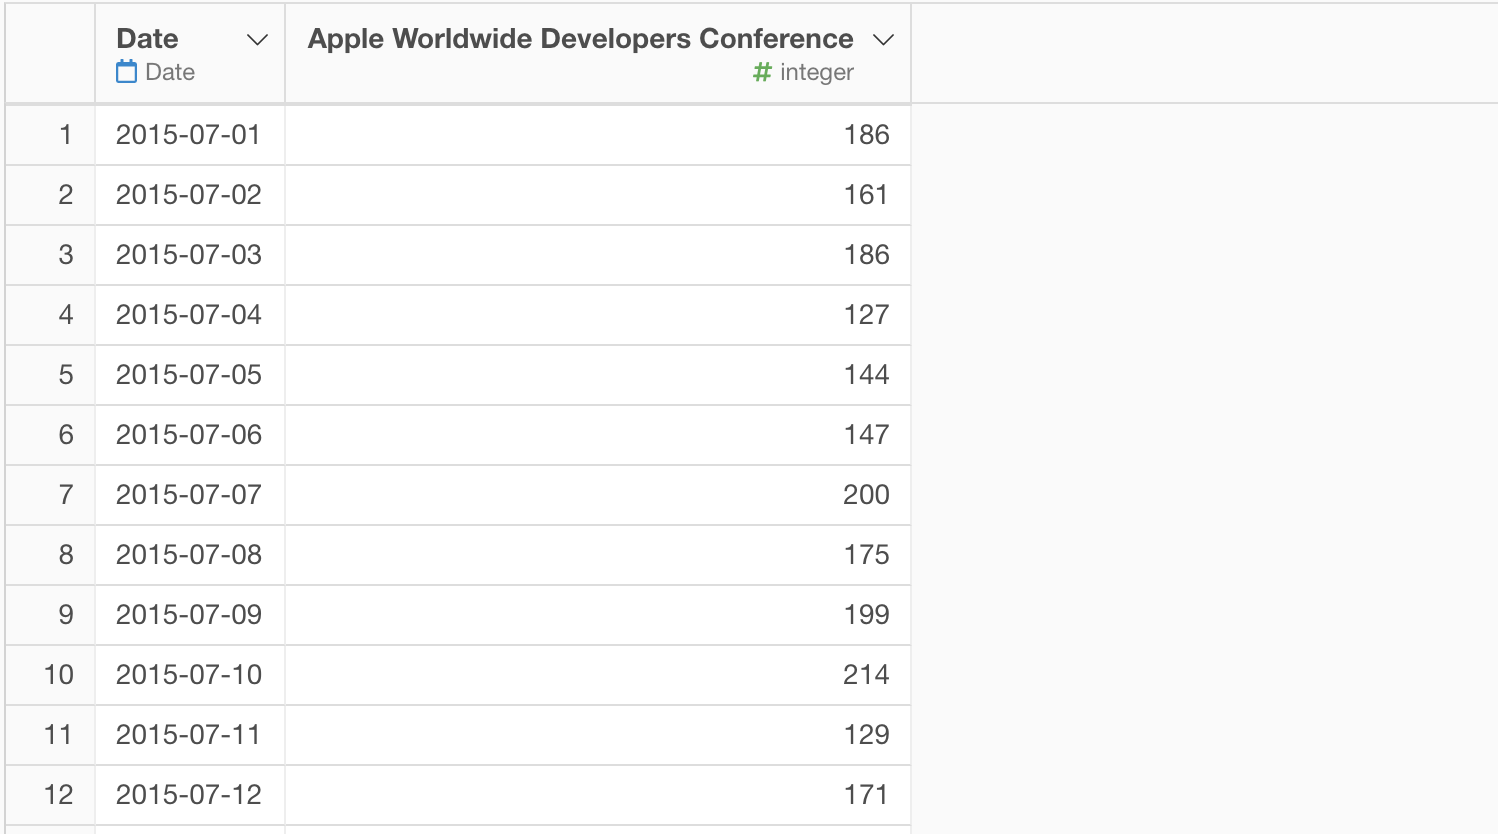
By visualizing it with line chart, we can see that there are some big spikes. These are the days when Apple Worldwide Developers Conference was actually going on, which must have had effect on the page views of the Wikipedia article written about it.

Forecast without Consideration on Holiday Effect
First, let’s make a forecast without giving special considerations on the effect of the days WWDC is actuall held on.

The forecasted value seems to capture the overall trend well, but it is not reproducing the big spikes during the WWDC days.
Custom Holiday Data
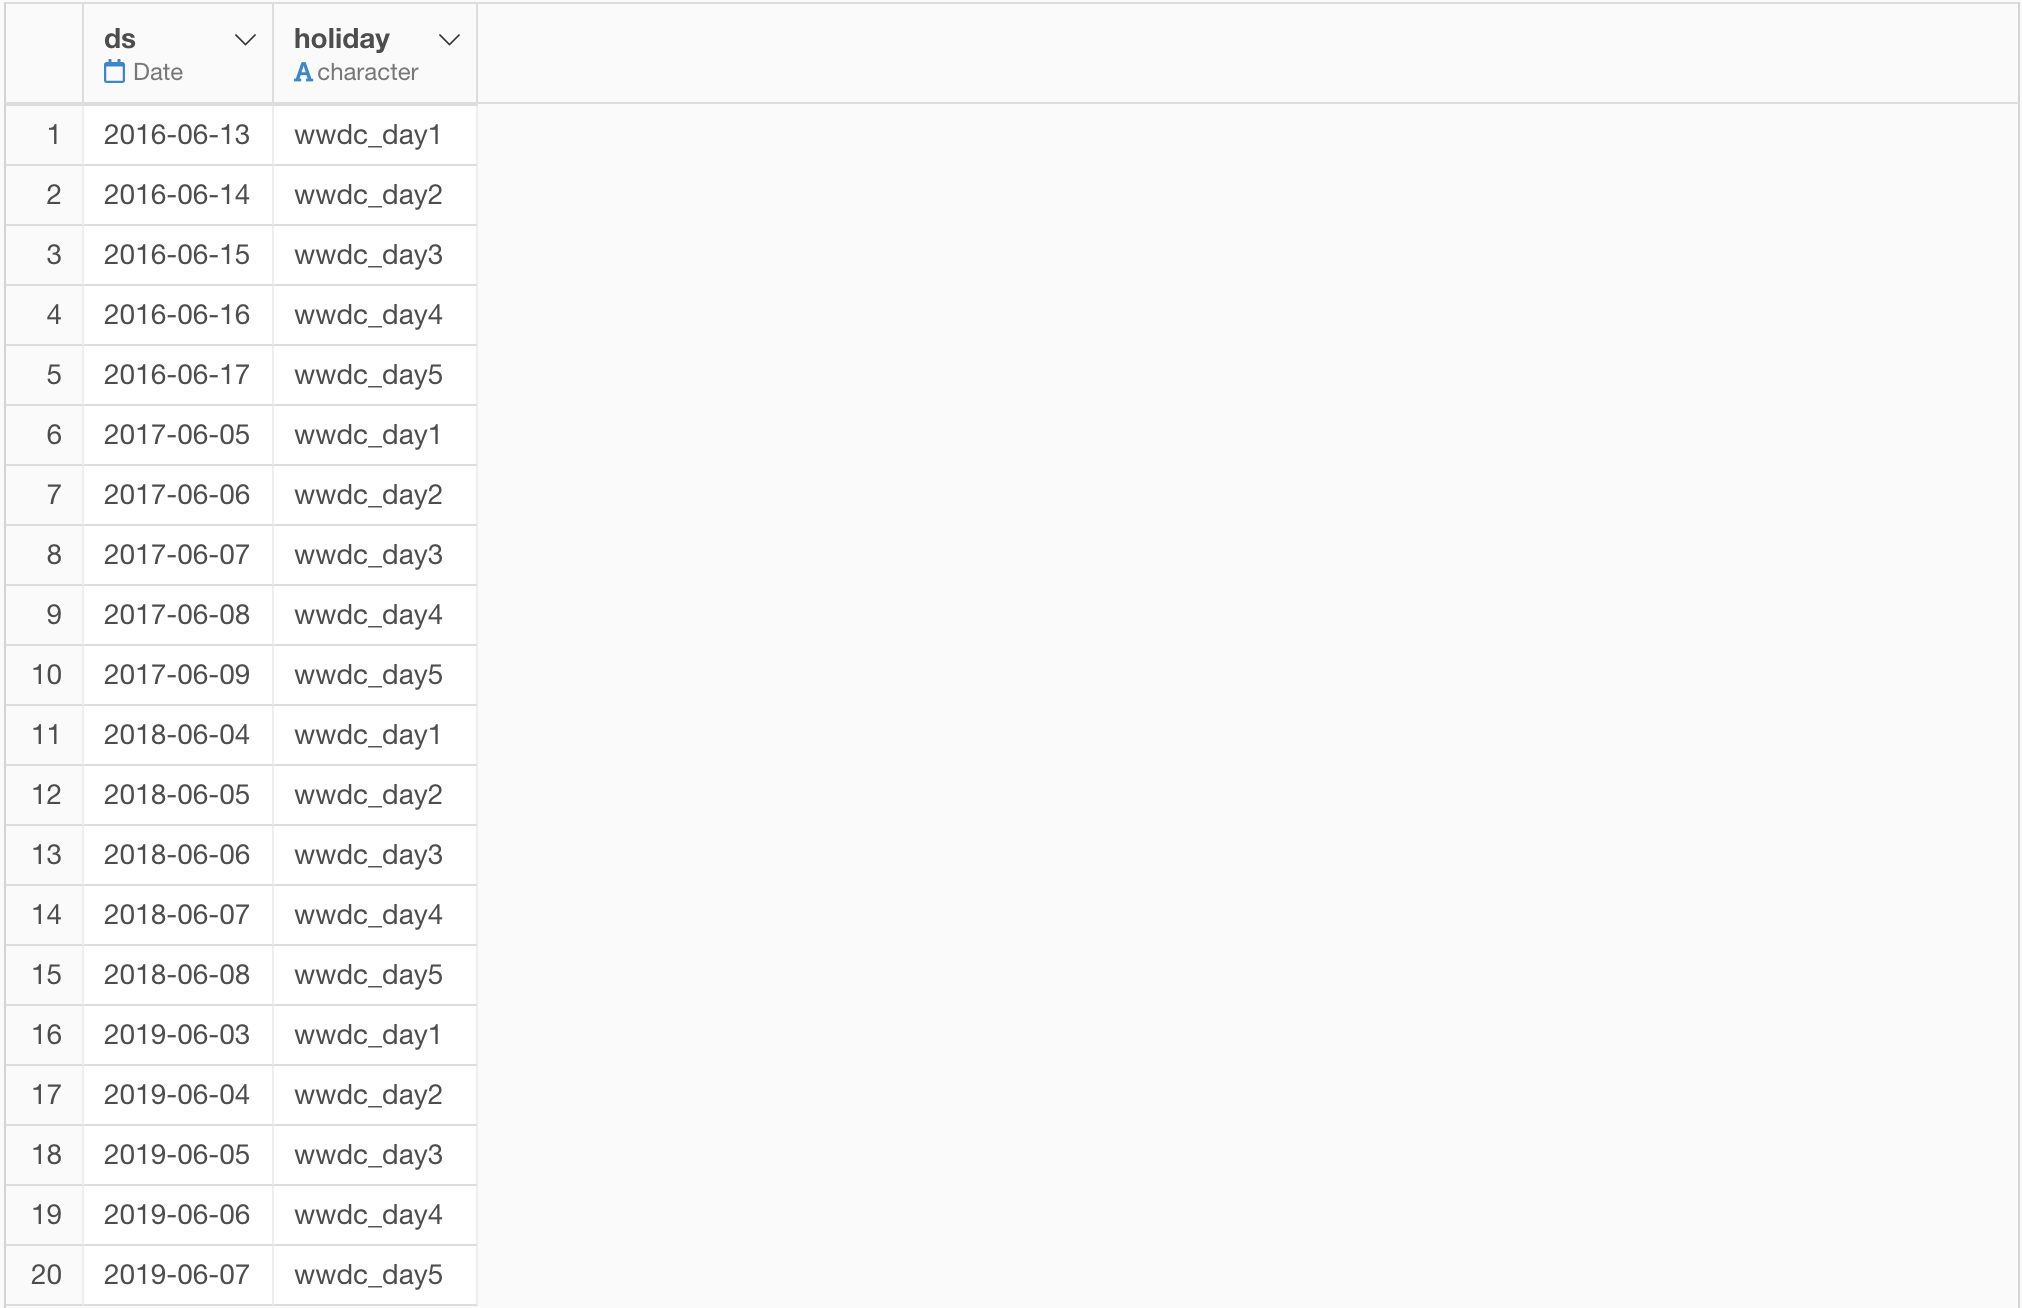
Here, let’s feed the days of WWDC as holiday information to the Prophet model we are building. Though the WWDC days are not exactly holidays, we are calling them “holidays”, meaning that they are the days that could have special effect on the value we are trying to forecast.
In this data, ds column has dates of past WWDC days, as well as future dates WWDC will probably be held on. holidays column have info on which one of the 5 days of a WWDC the day is, so that the model can treat the effect of each day of WWDC differently rather than uniformly.
Joining the Holiday Data to the Original Data
We full-join this data to the original data of the views of WWDC Wikipedia Page. We do full-join as opposed to more commonly used left-join, because we want to keep the future part of WWDC date data for the forecast, and left-join would drop that part of the data.
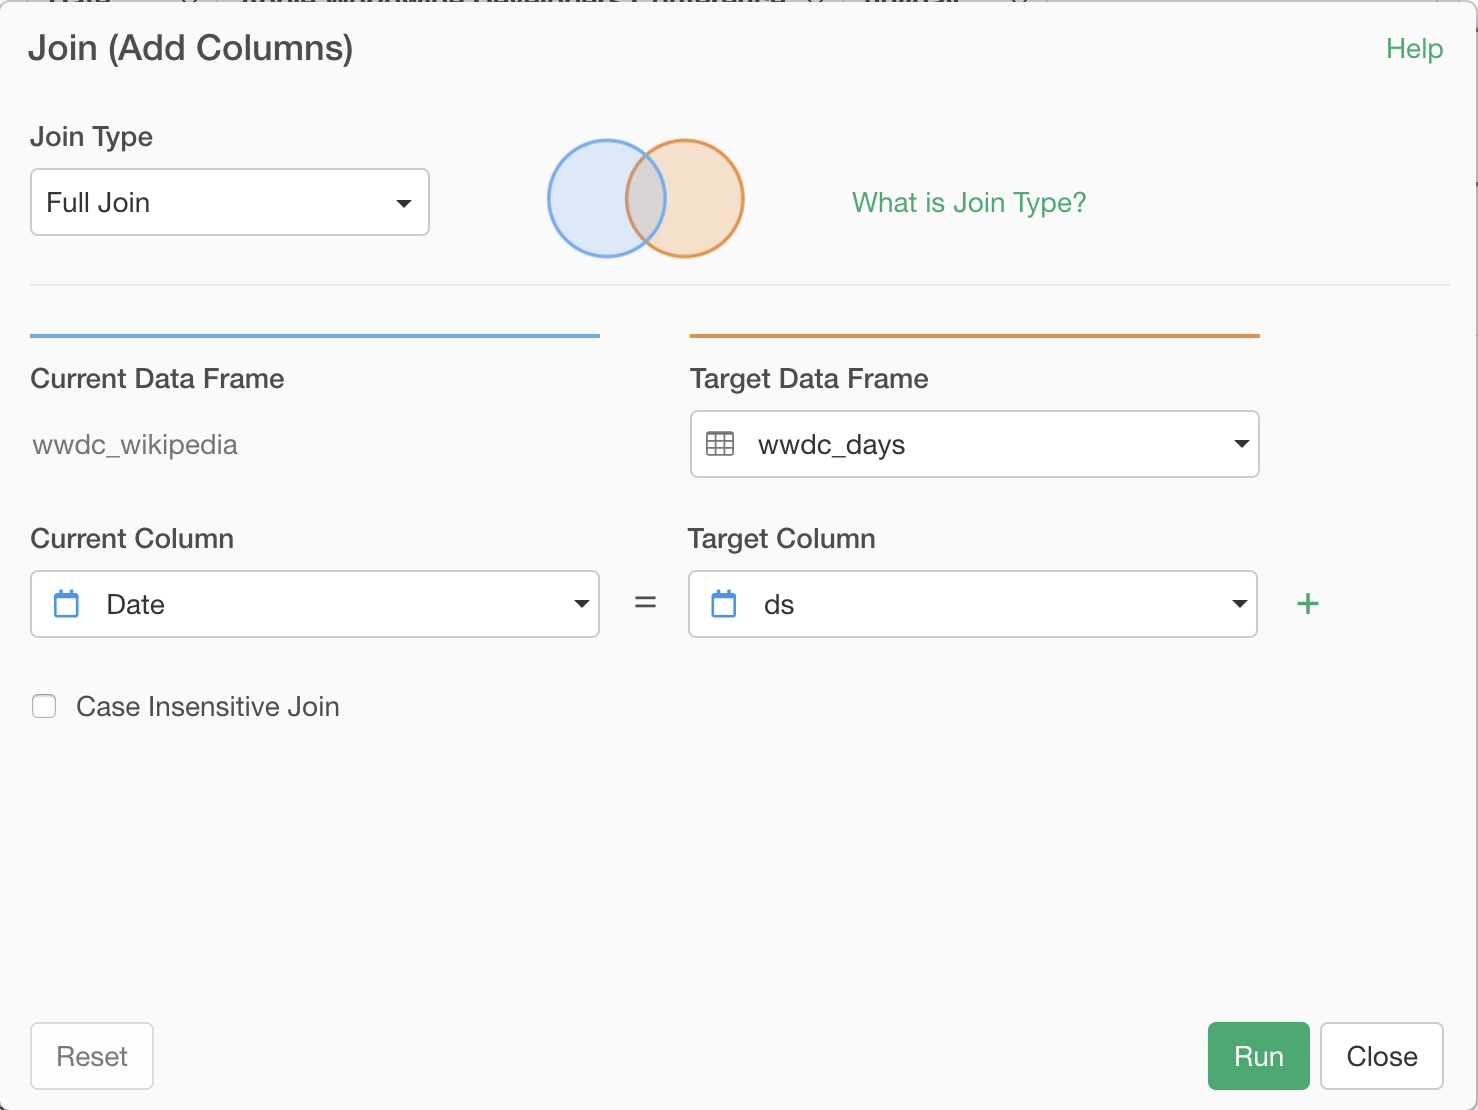
As the result of join, holiday column, which holds WWDC dates in the past as well as into the future, is added to the original page view data.

Forecasting with Consideration on Holiday Effect
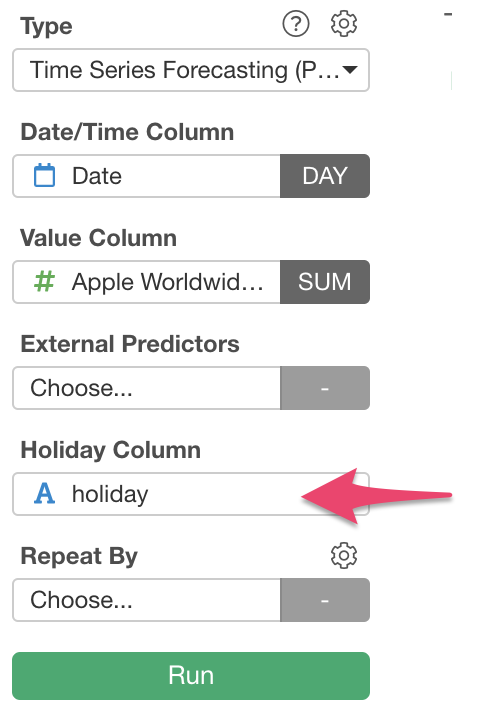
Now let’s get back to the Analytics View of Time Series Forecasting, and select holiday column as the Holiday Column.
Following is the result of the forecast.
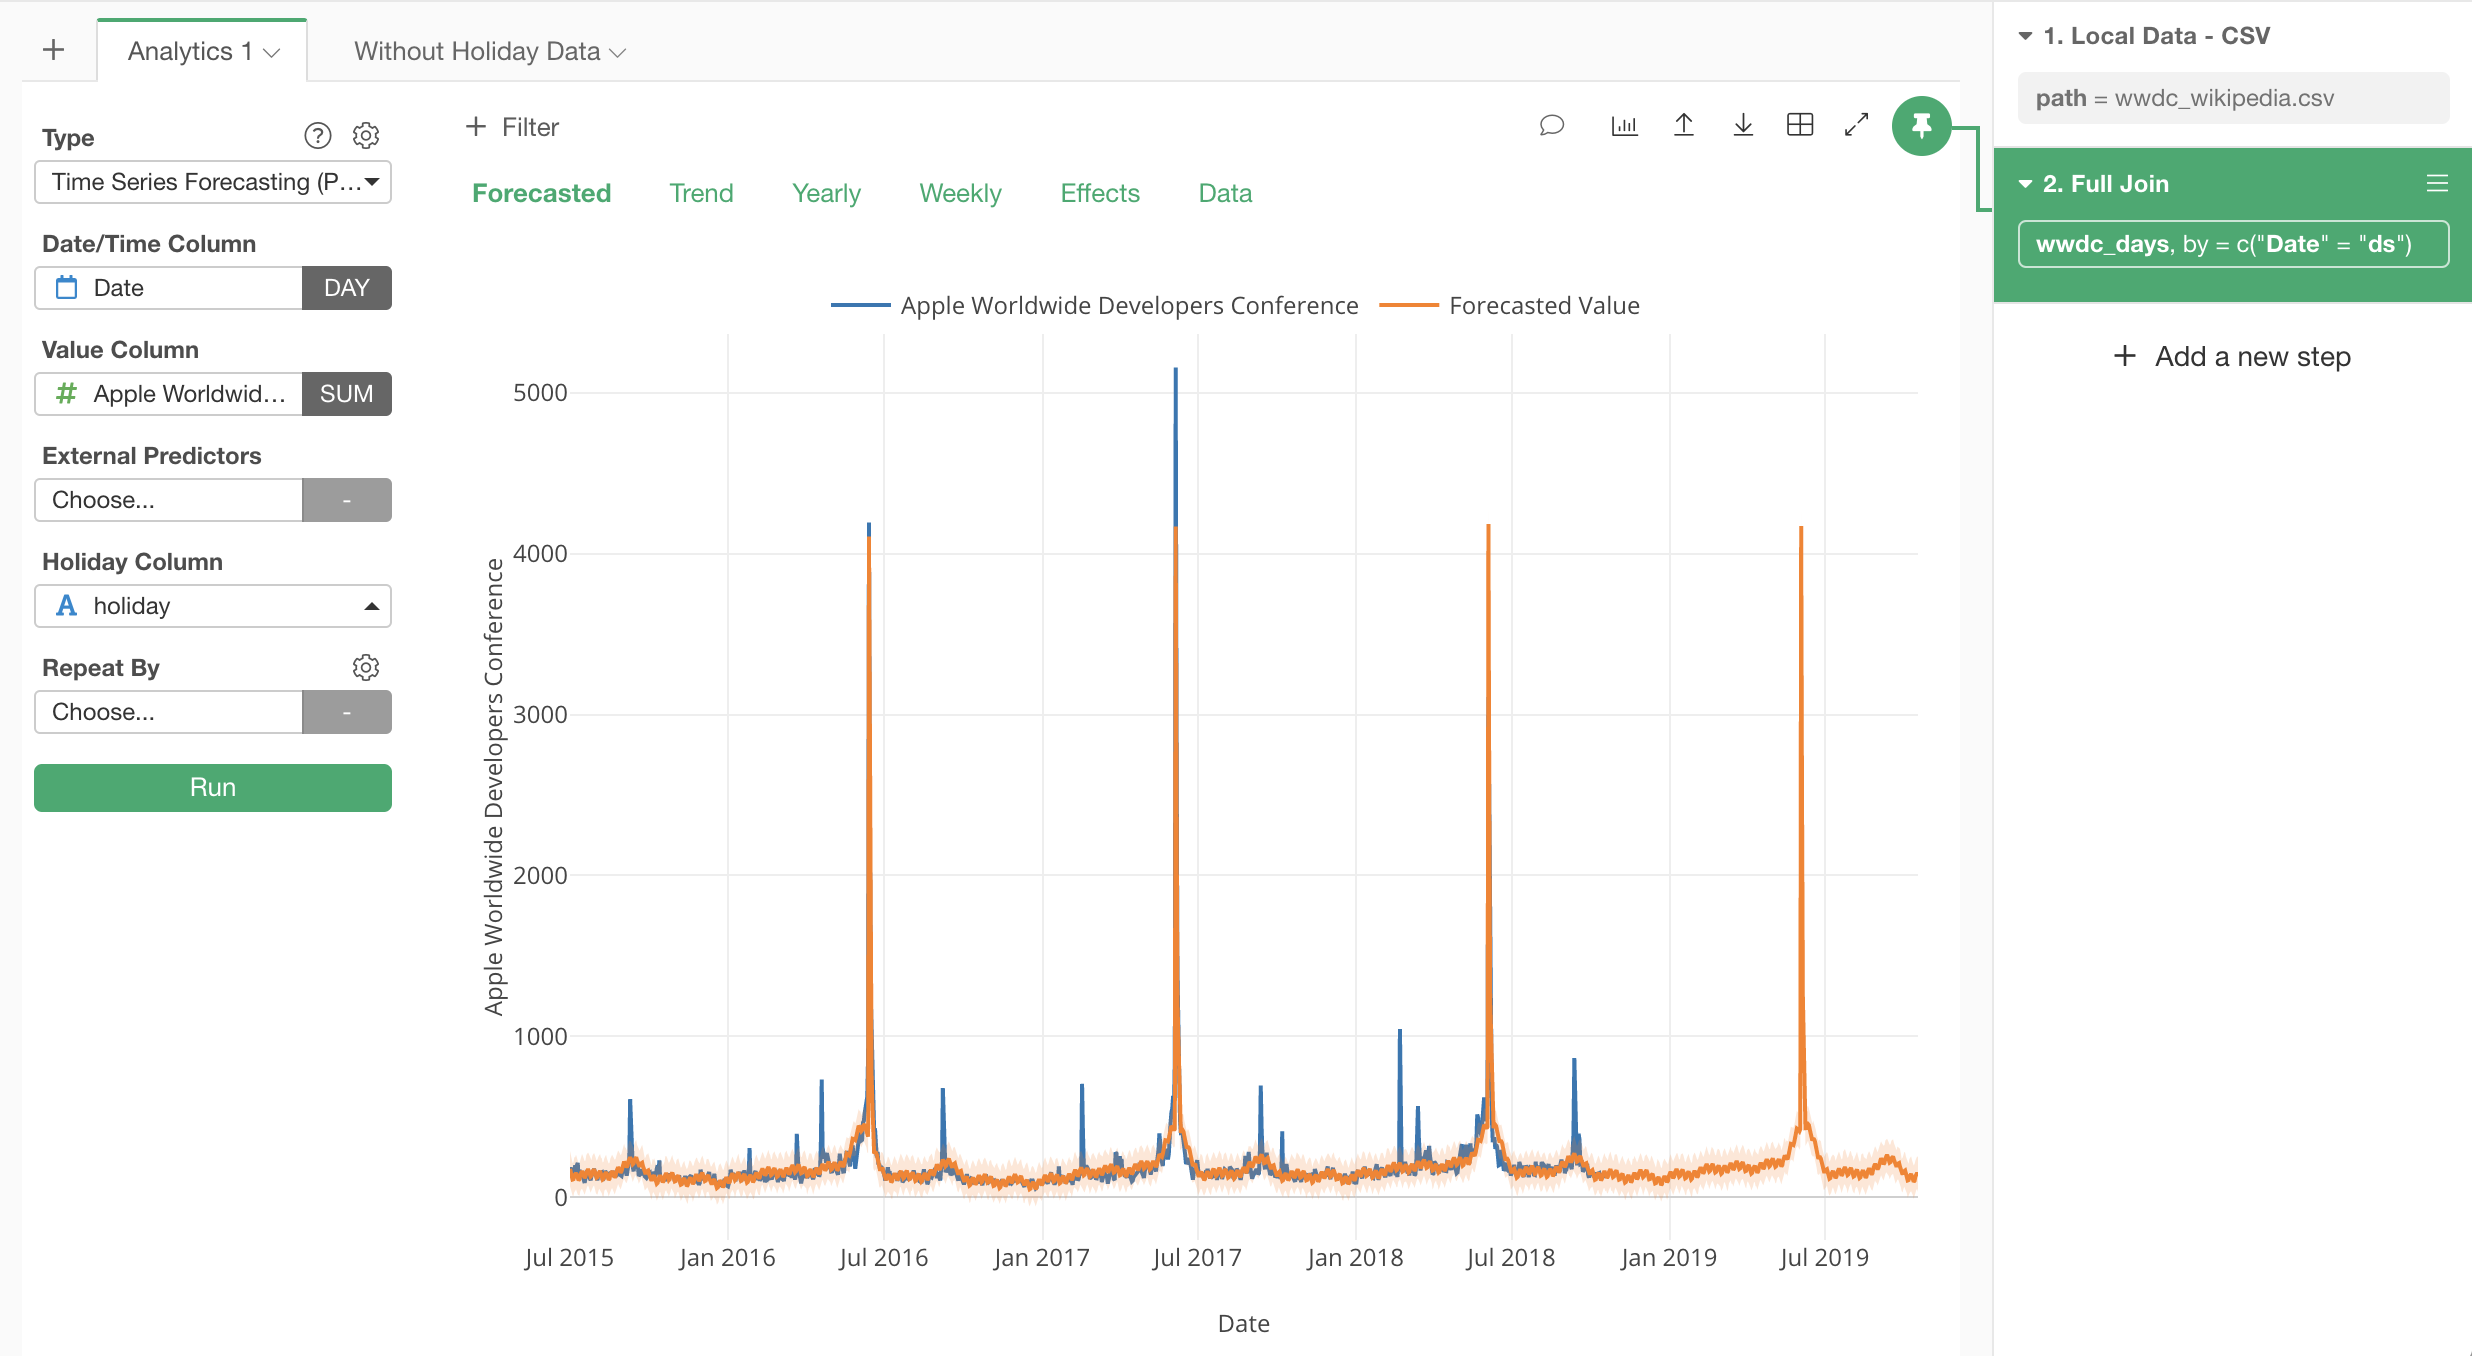
This time, the big sharp spike of the WWDC days are reproduced well in the forecast!
To look into more detail of this forecasting result, by dragging mouse in the following chart, you can zoom into any particular area of the chart.
Also, you can reproduce the entire data analysis process of this note by downloading edf file clicking “Download” button on the right hand side top of this page, and importing it into Exploratory Desktop.