Calculating the Engagement KPI - DAU/MAU with Google Analytics
Everyone agrees that engagement is the most important metric for subscription businesses including SaaS (Software-as-a-Service).
But how you define the engagement is another story.
One of the very commonly used metrics for the engagement is called DAU/MAU, which was popularized by Facebook when they used it in the early phase. It literally divides the DAU (Daily Active Users) by MAU (Monthly Active Users).
DAU or MAU alone can be easily manipulated by aggressively buying new users. But that's not what you want when you care about how much your users or customers are engaging with your services or products.
The cool thing about the DAU/MAU metric is that it increases only when the same users come back to use your service more often during the same month. Thus, DAU/MAU is a better proxy metric for the engagement.
Today, I'll show you how you can calculate the DAU/MAU by using Google Analytics (GA) data.
Luckily, GA provides DAU and MAU metrics data, so you can create your own DAU/MAU with Google Analytics data pretty quickly.
Here are the 4 steps to calculate it and visualize it.
- Get DAU and MAU data from GA
- Join DAU and MAU data
- Calculate DAU / MAU
- Visualize DAU / MAU
Let's start.
1. Get DAU and MAU data from GA
First, we want to get the DAU and the MAU data from Google Analytics (GA).
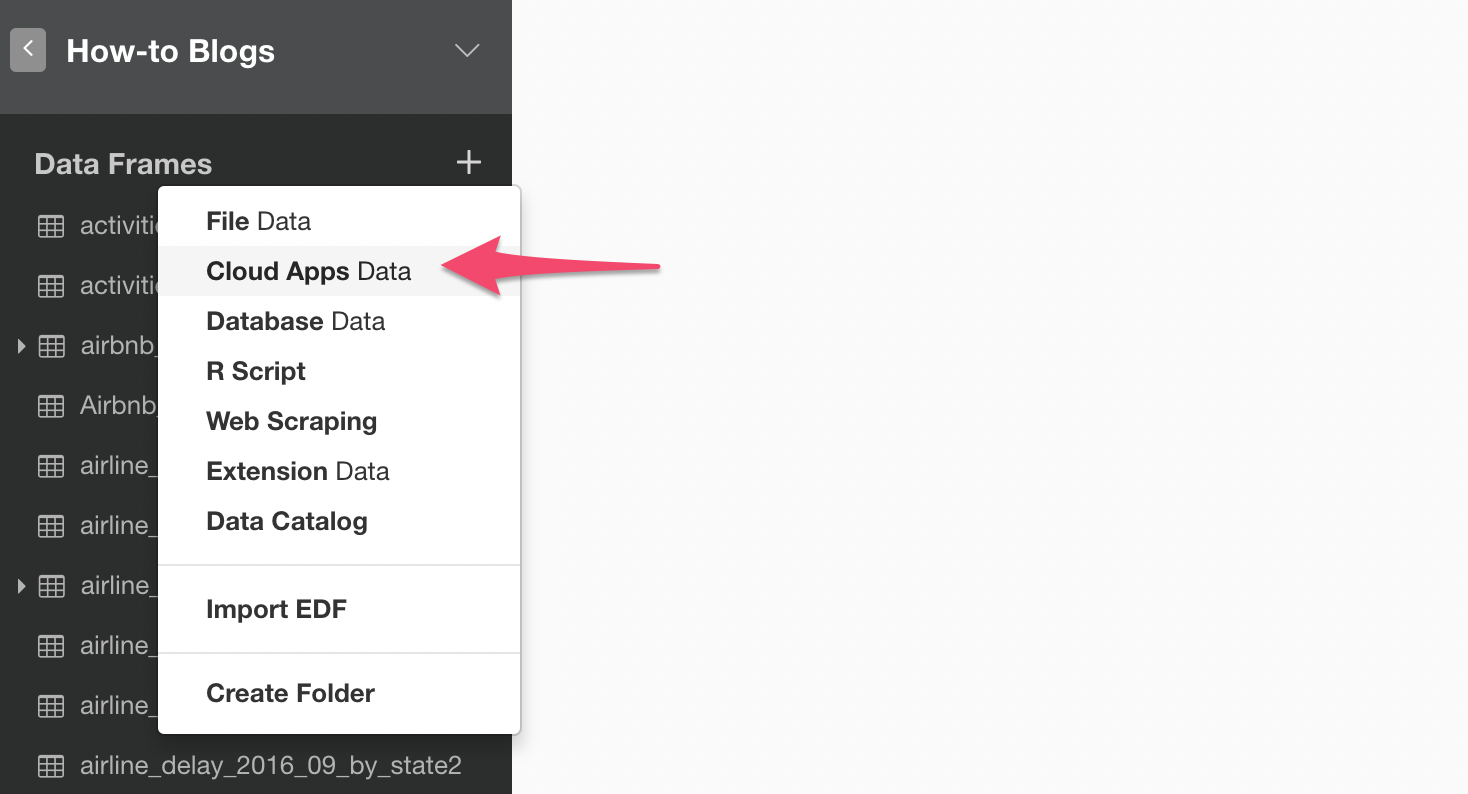
Select 'Cloud Apps Data' from the Data Frames menu.
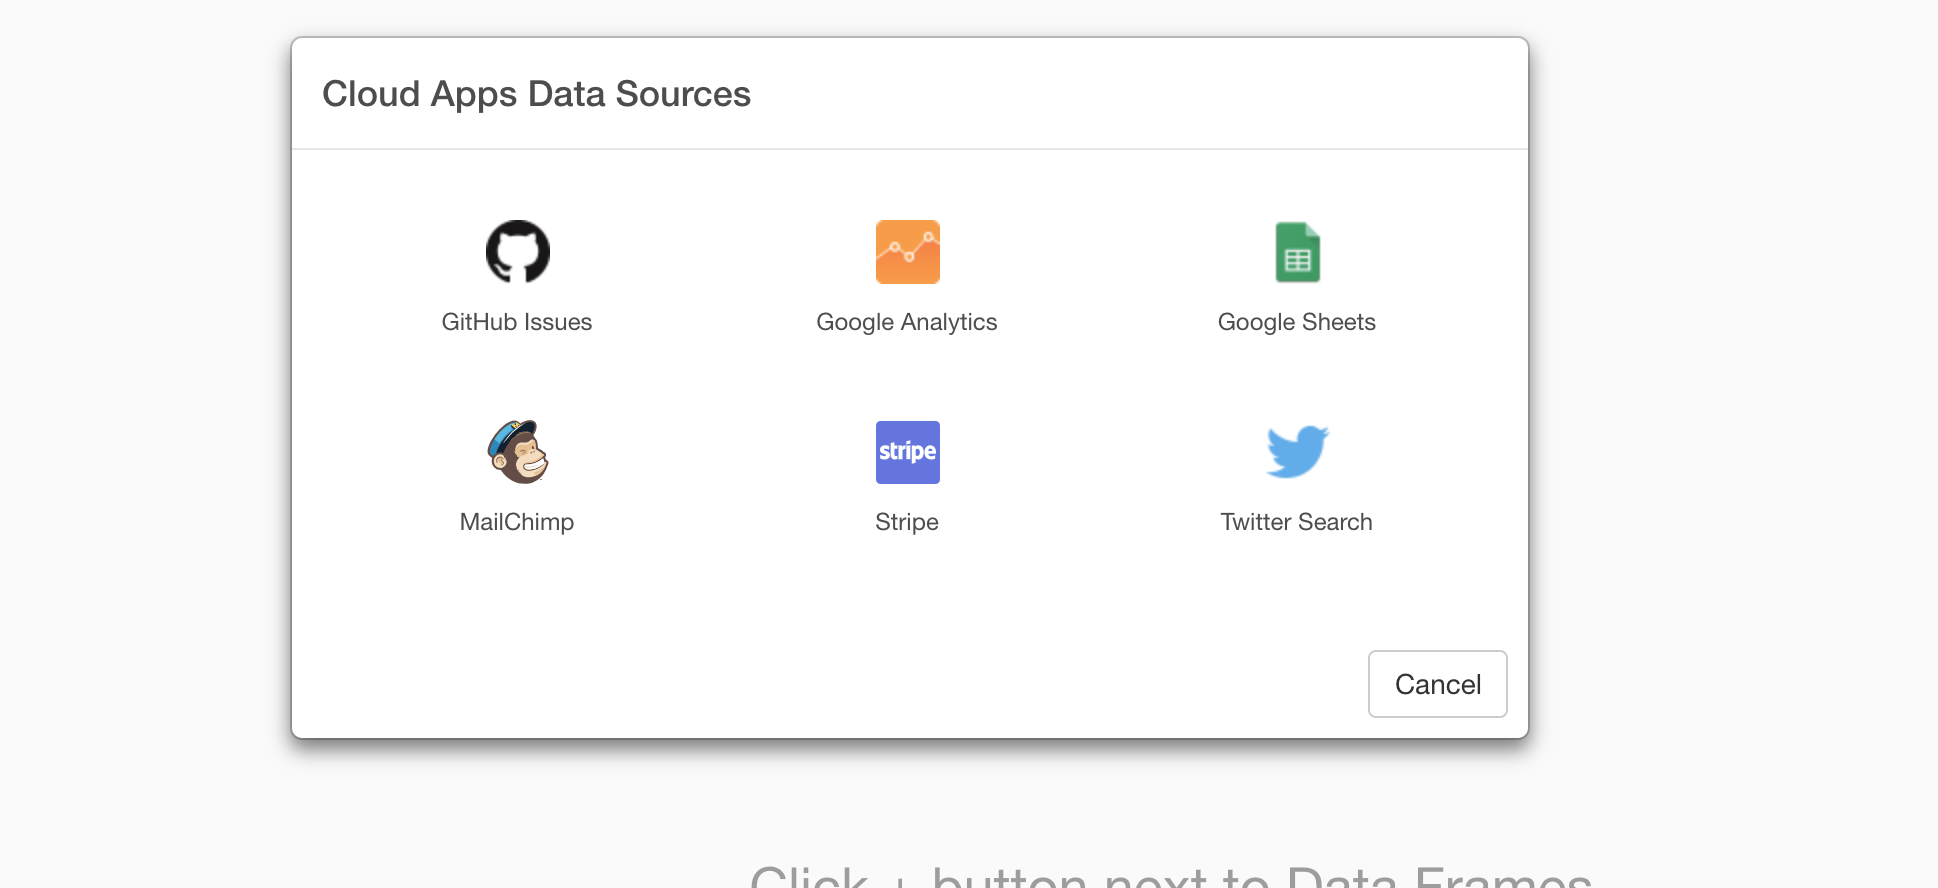
Select 'Google Analytics' data source.
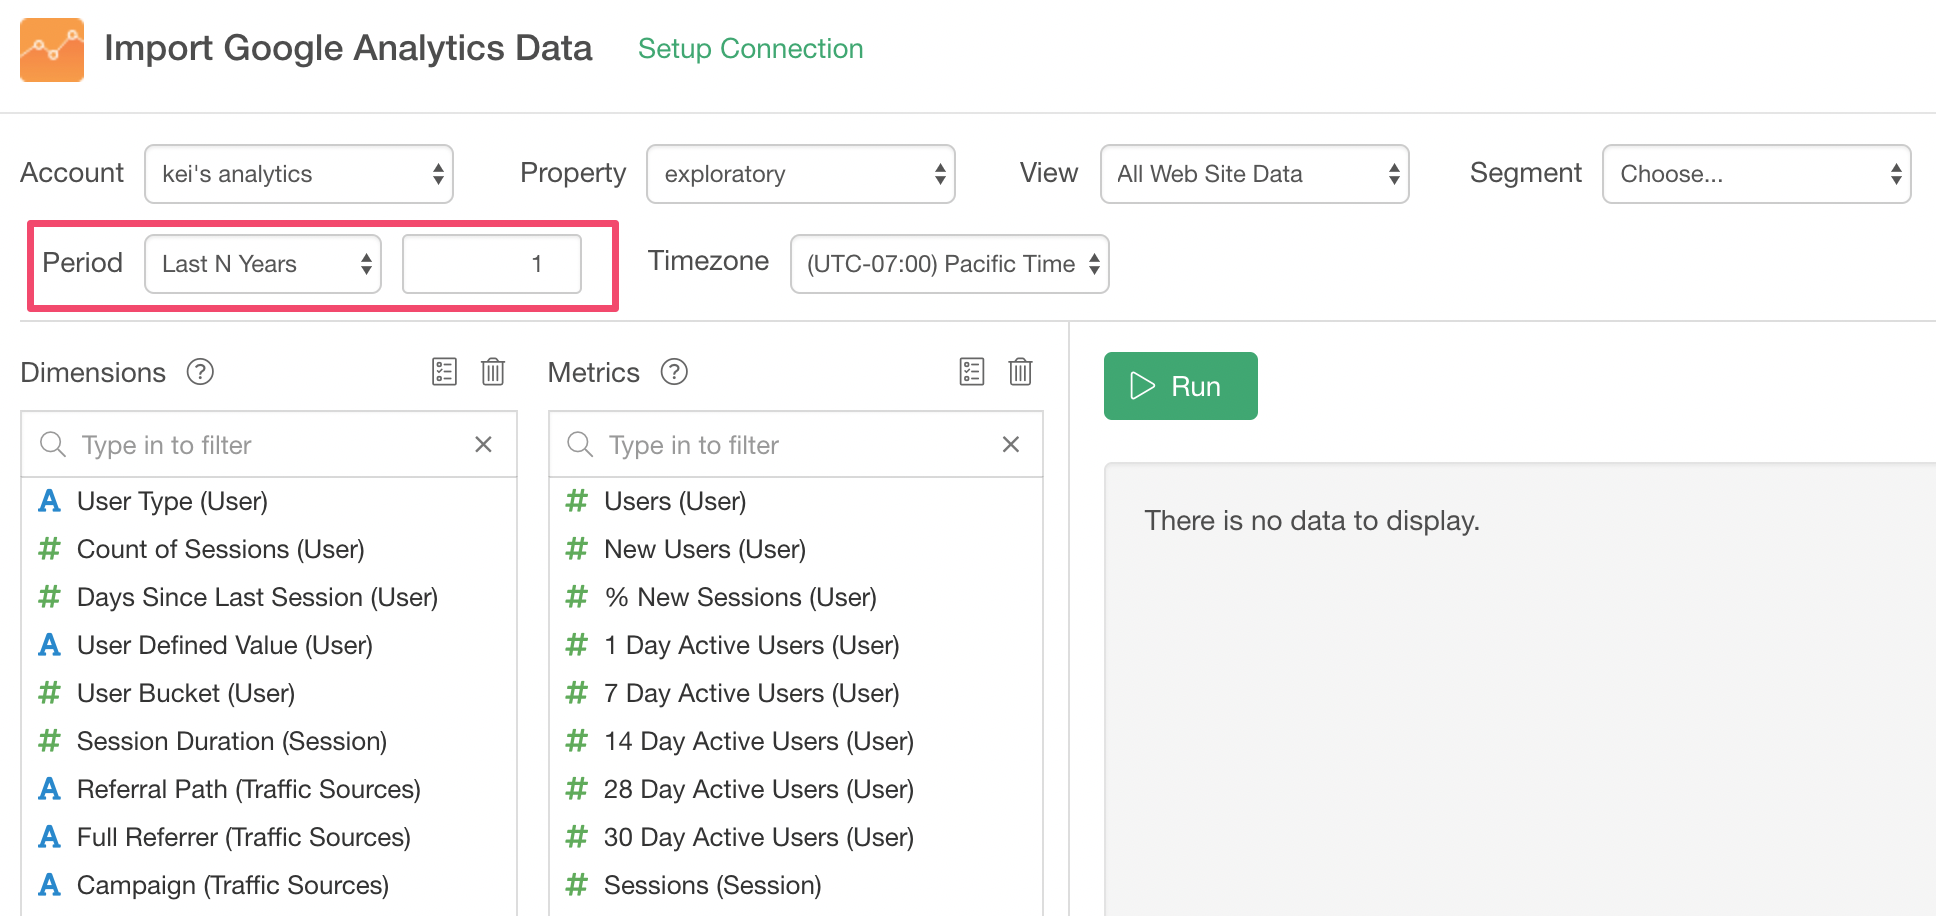
Select the appropriate account, property, and view.
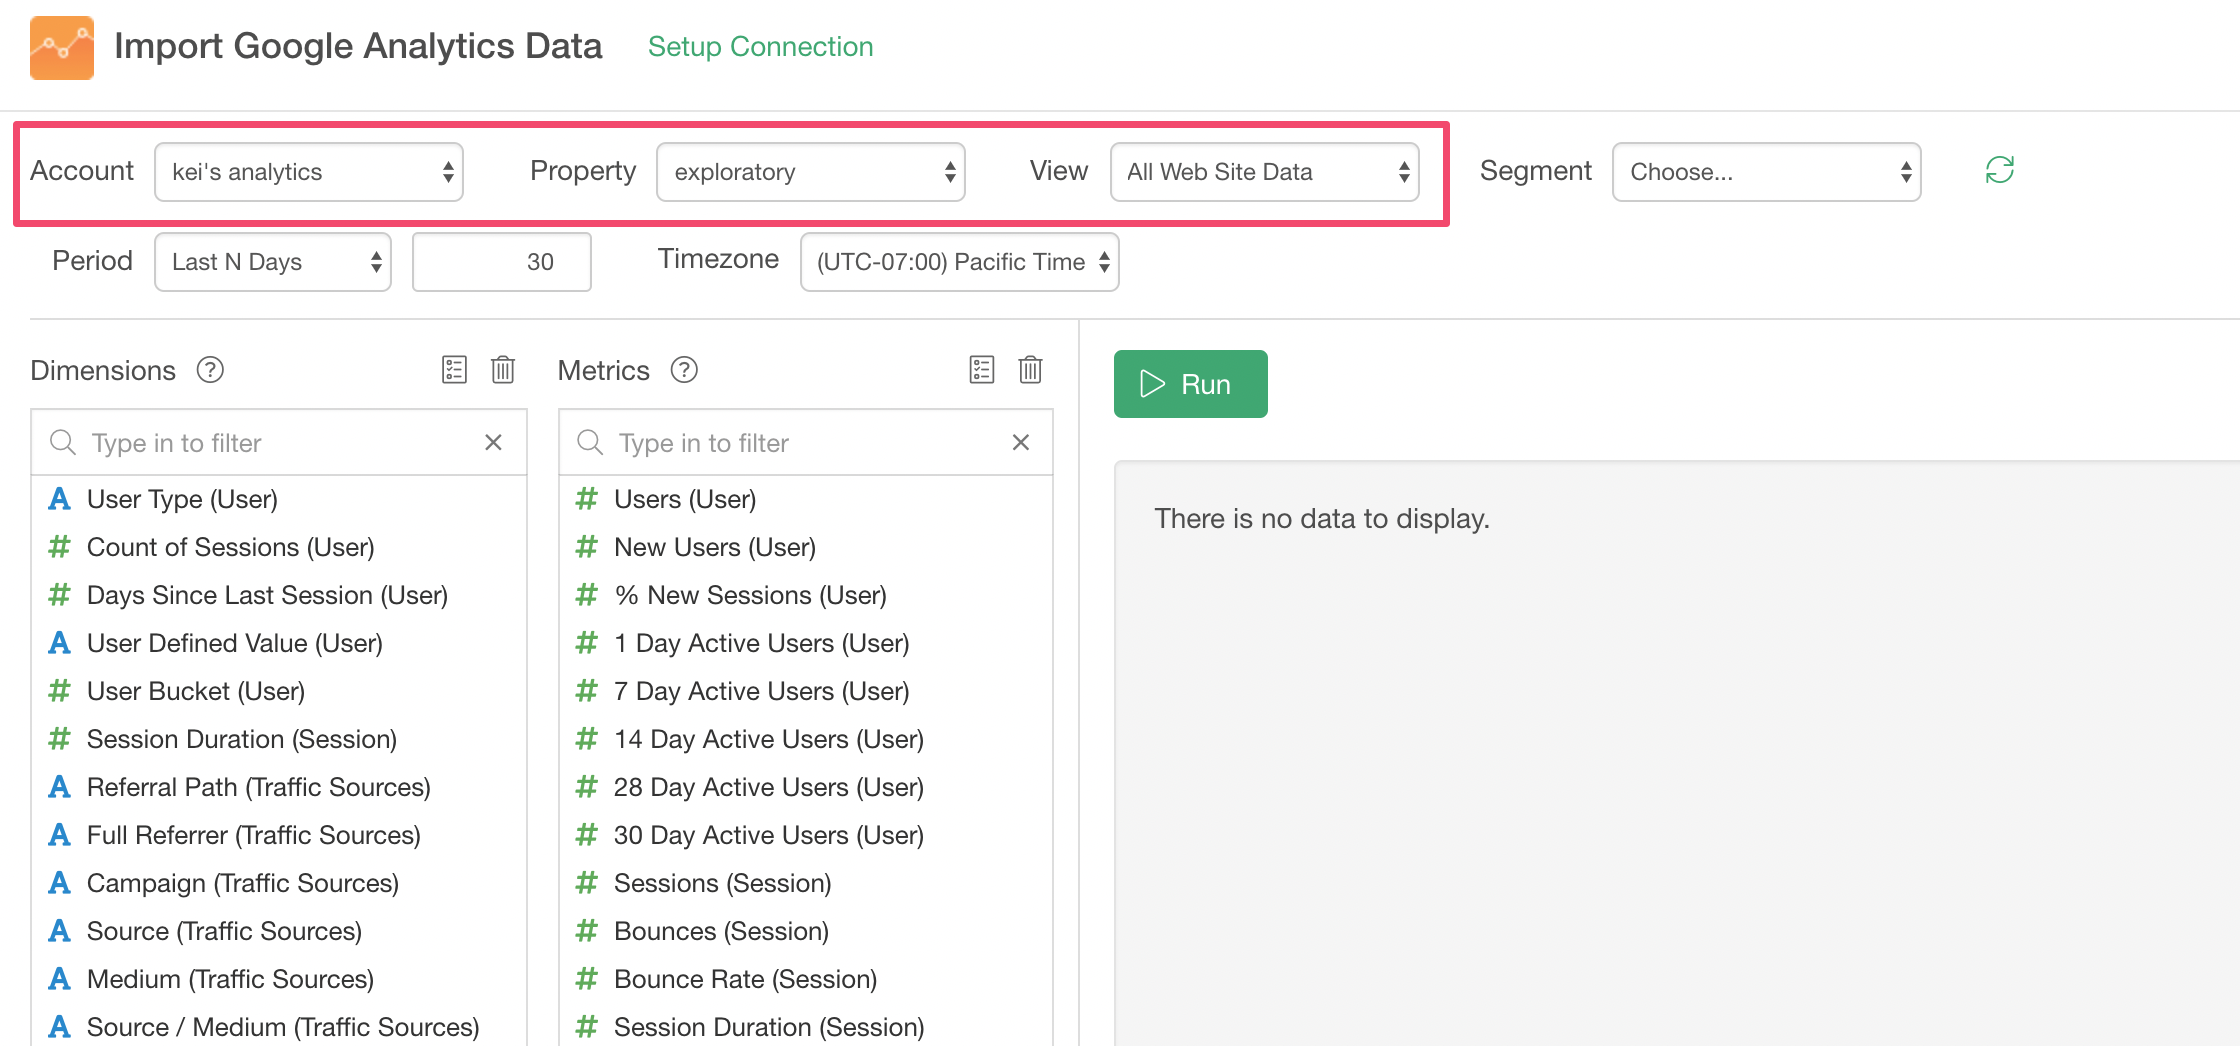
Select the period for data. This time, I'm selecting 'Last 1 Year'.
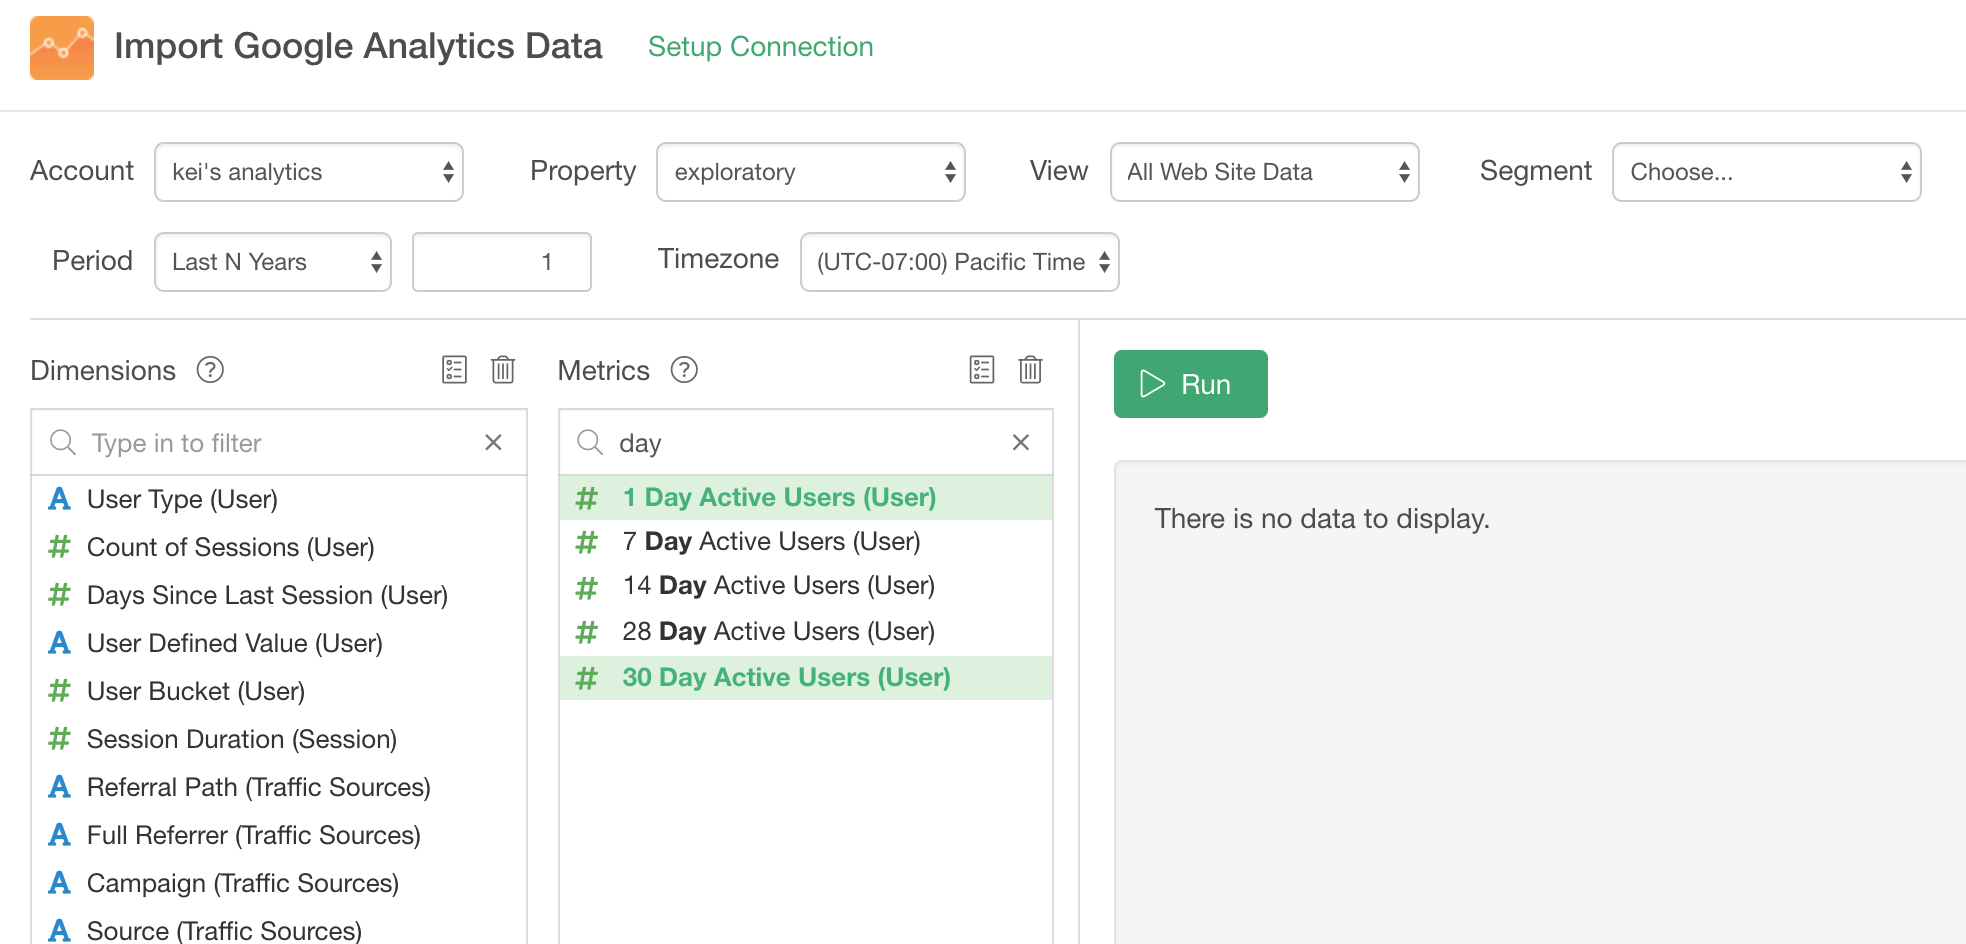
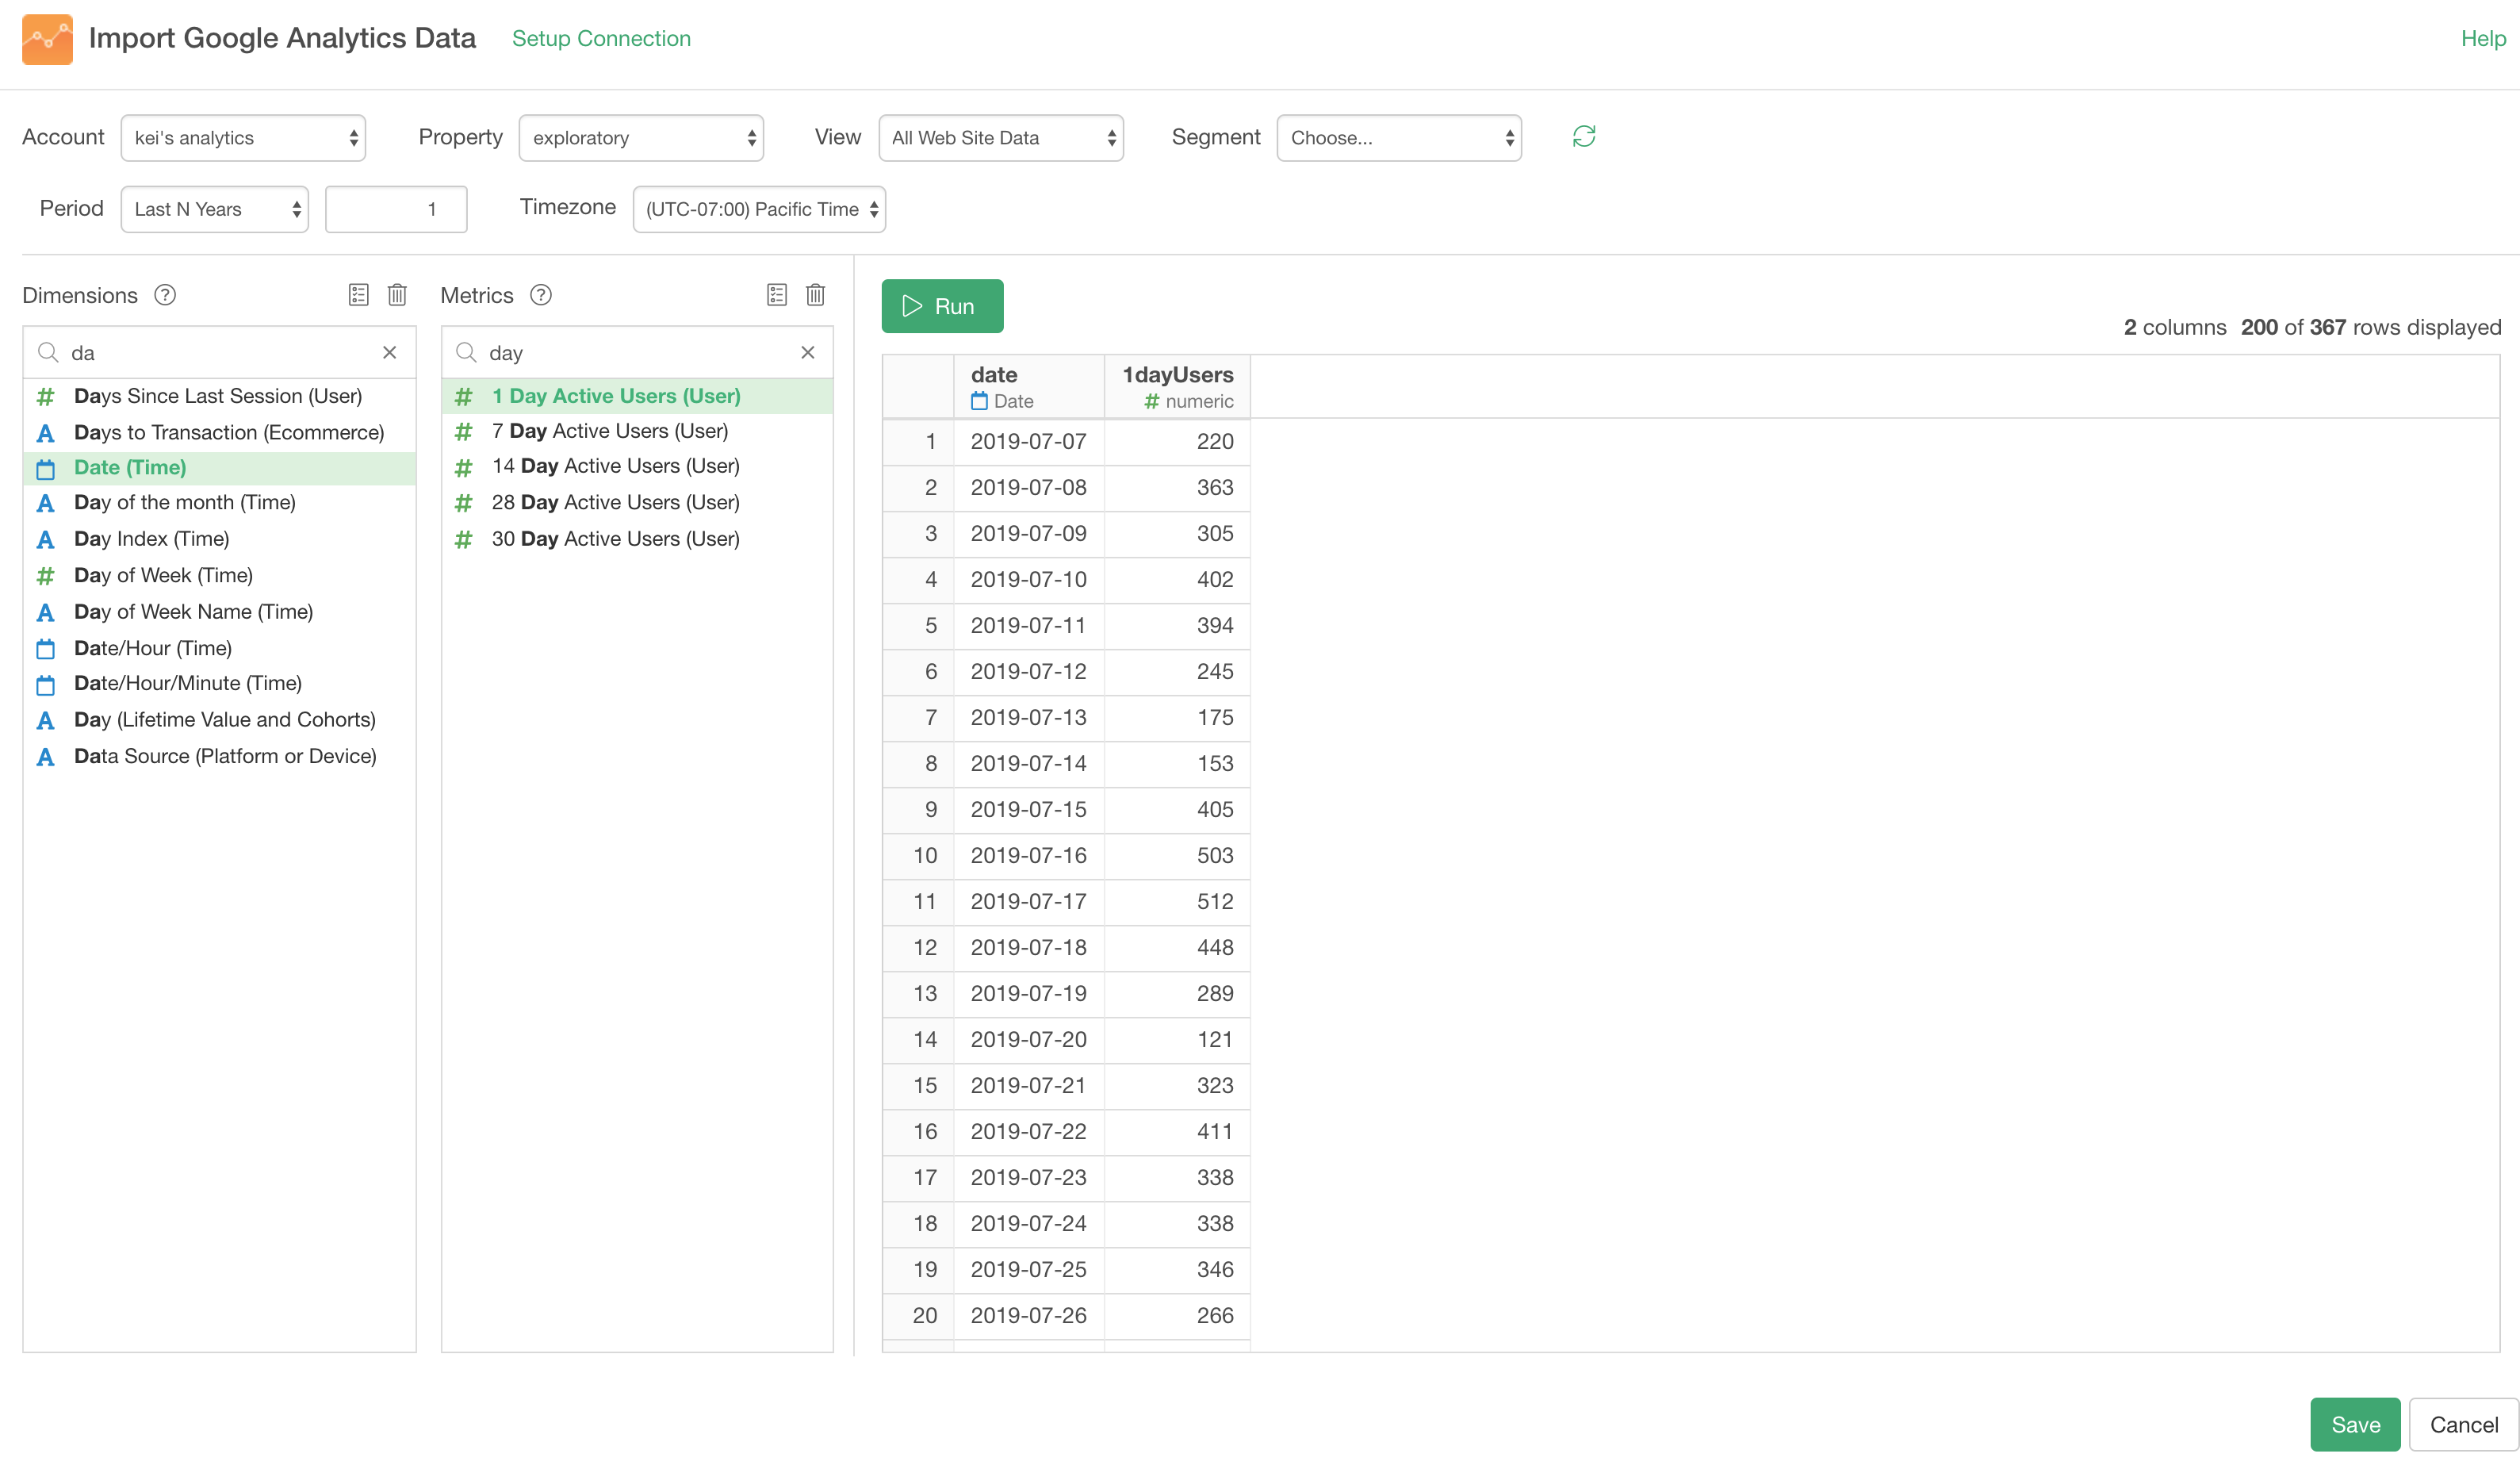
Now, we want to get DAU and MAU data.
GA provides '1 Day Active Users' and '30 Day Active Users'. These are basically the DAU and the MAU respectively.
Since we want to collect DAU and MAU data by day, we can select 'Date (Time)' dimension.
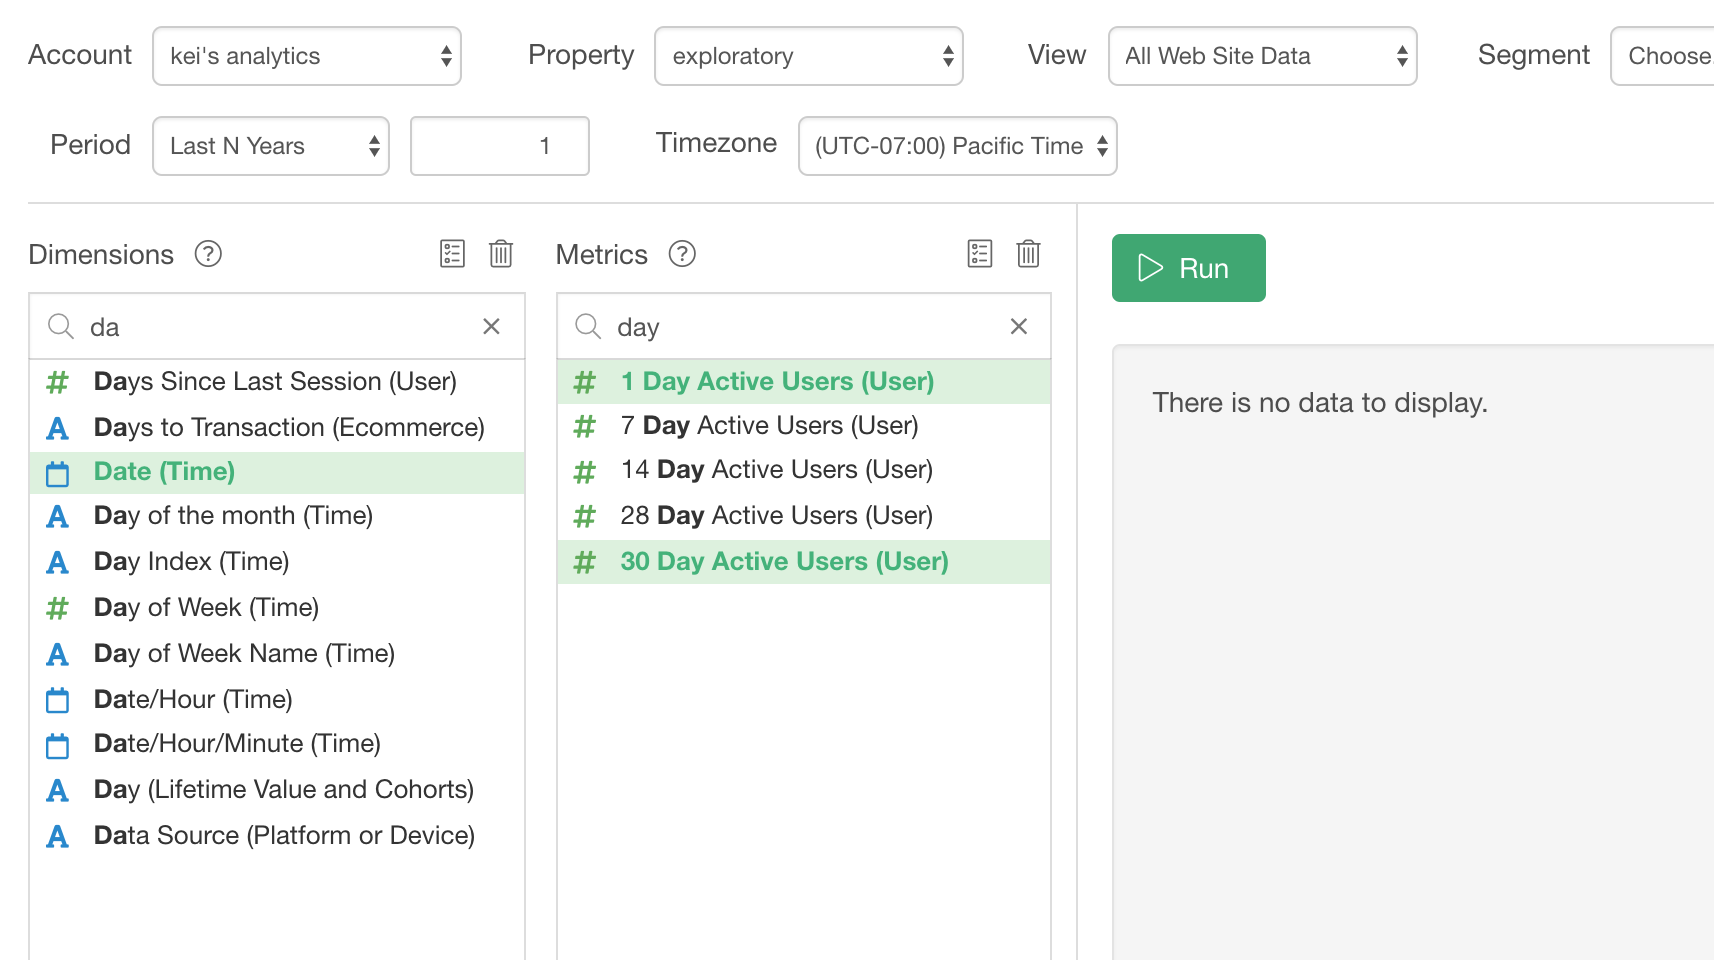
And click the 'Run' button.
However, we get this error complaining that these dimensions and measures can't be used together.
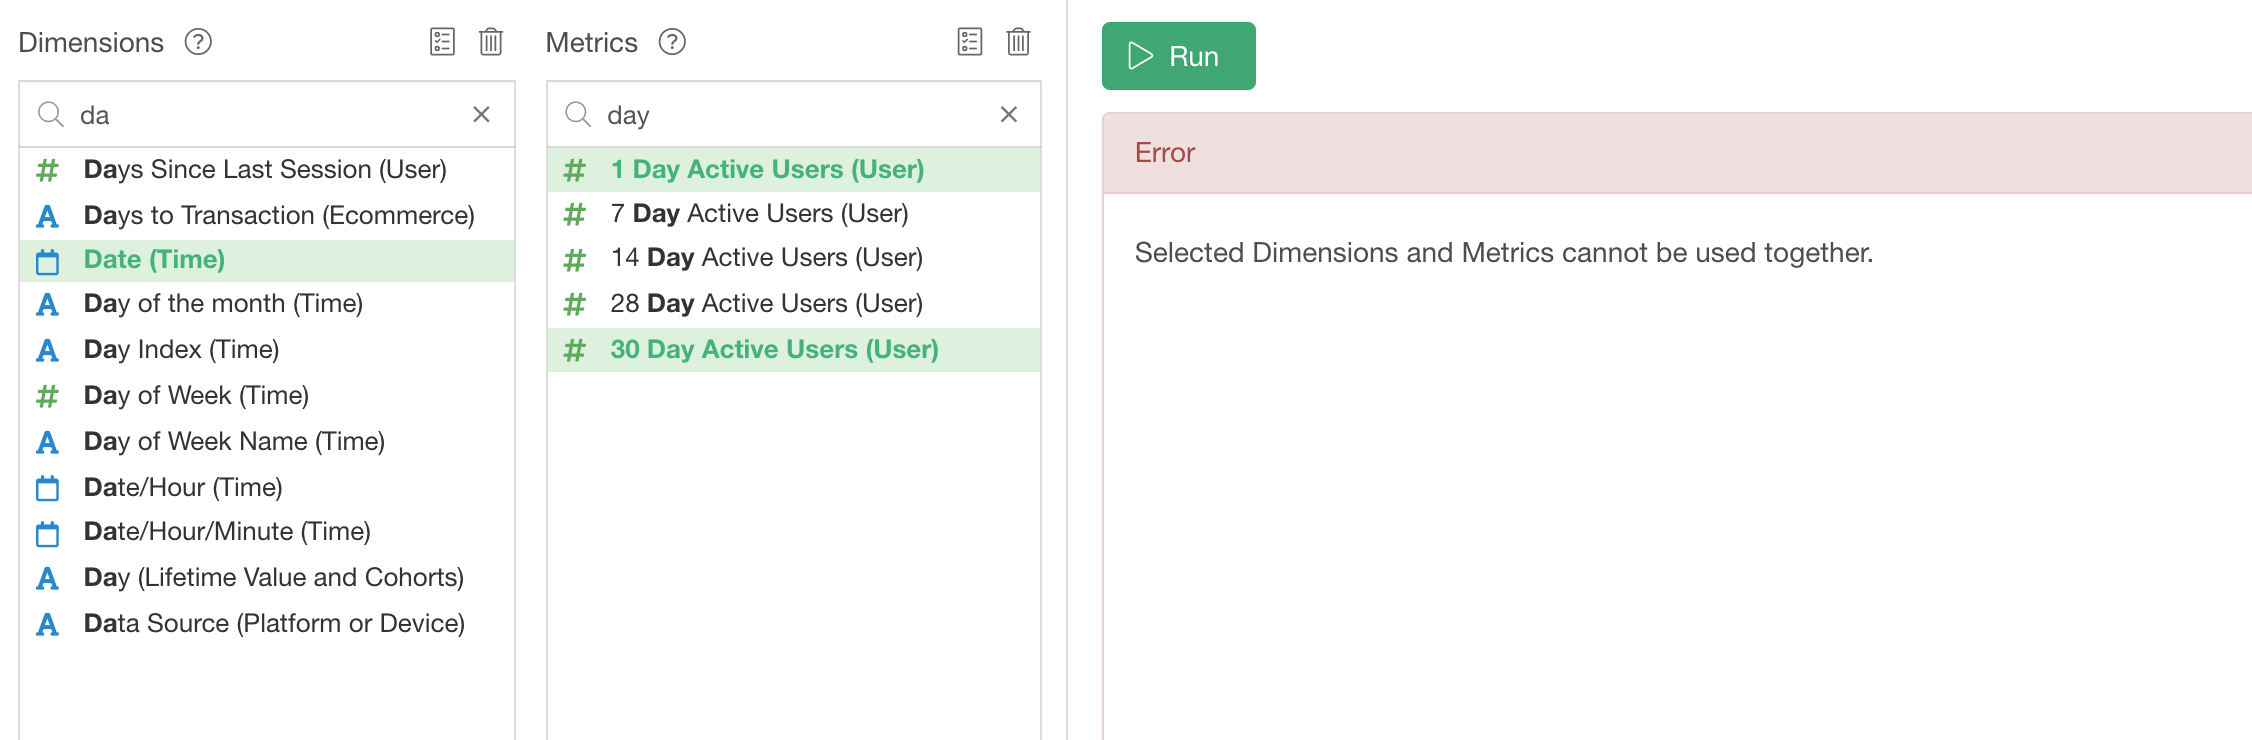
This is due to the limitation of GA, which doesn't allow certain combinations of dimensions and metrics that are aggregated at different levels. This time, the 1 Day Active Users is aggregated at a day level while the 30 day level is aggregated by every 30 days.
So, we want to get these 2 metrics data separately, then later we want to join them together in Exploratory.
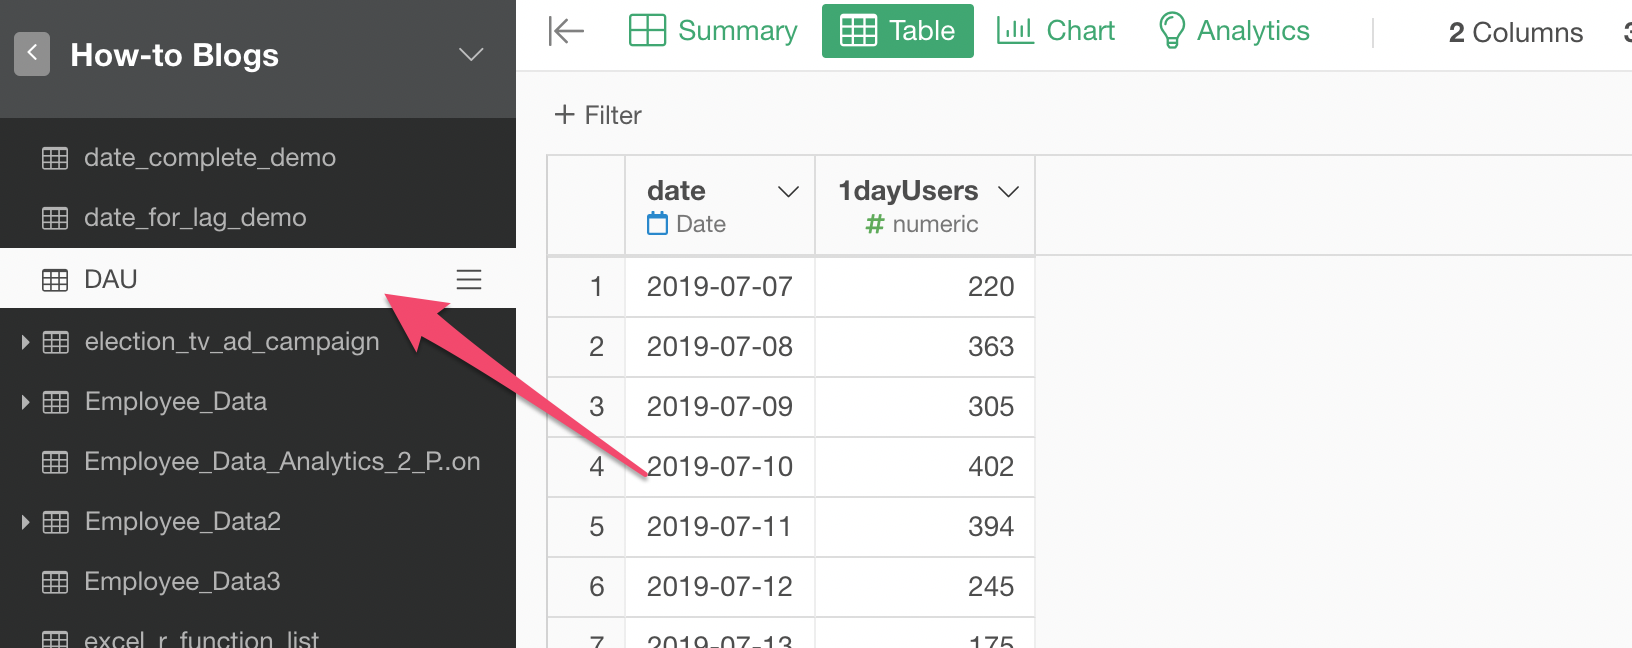
Get 1 Day Active Users for DAU
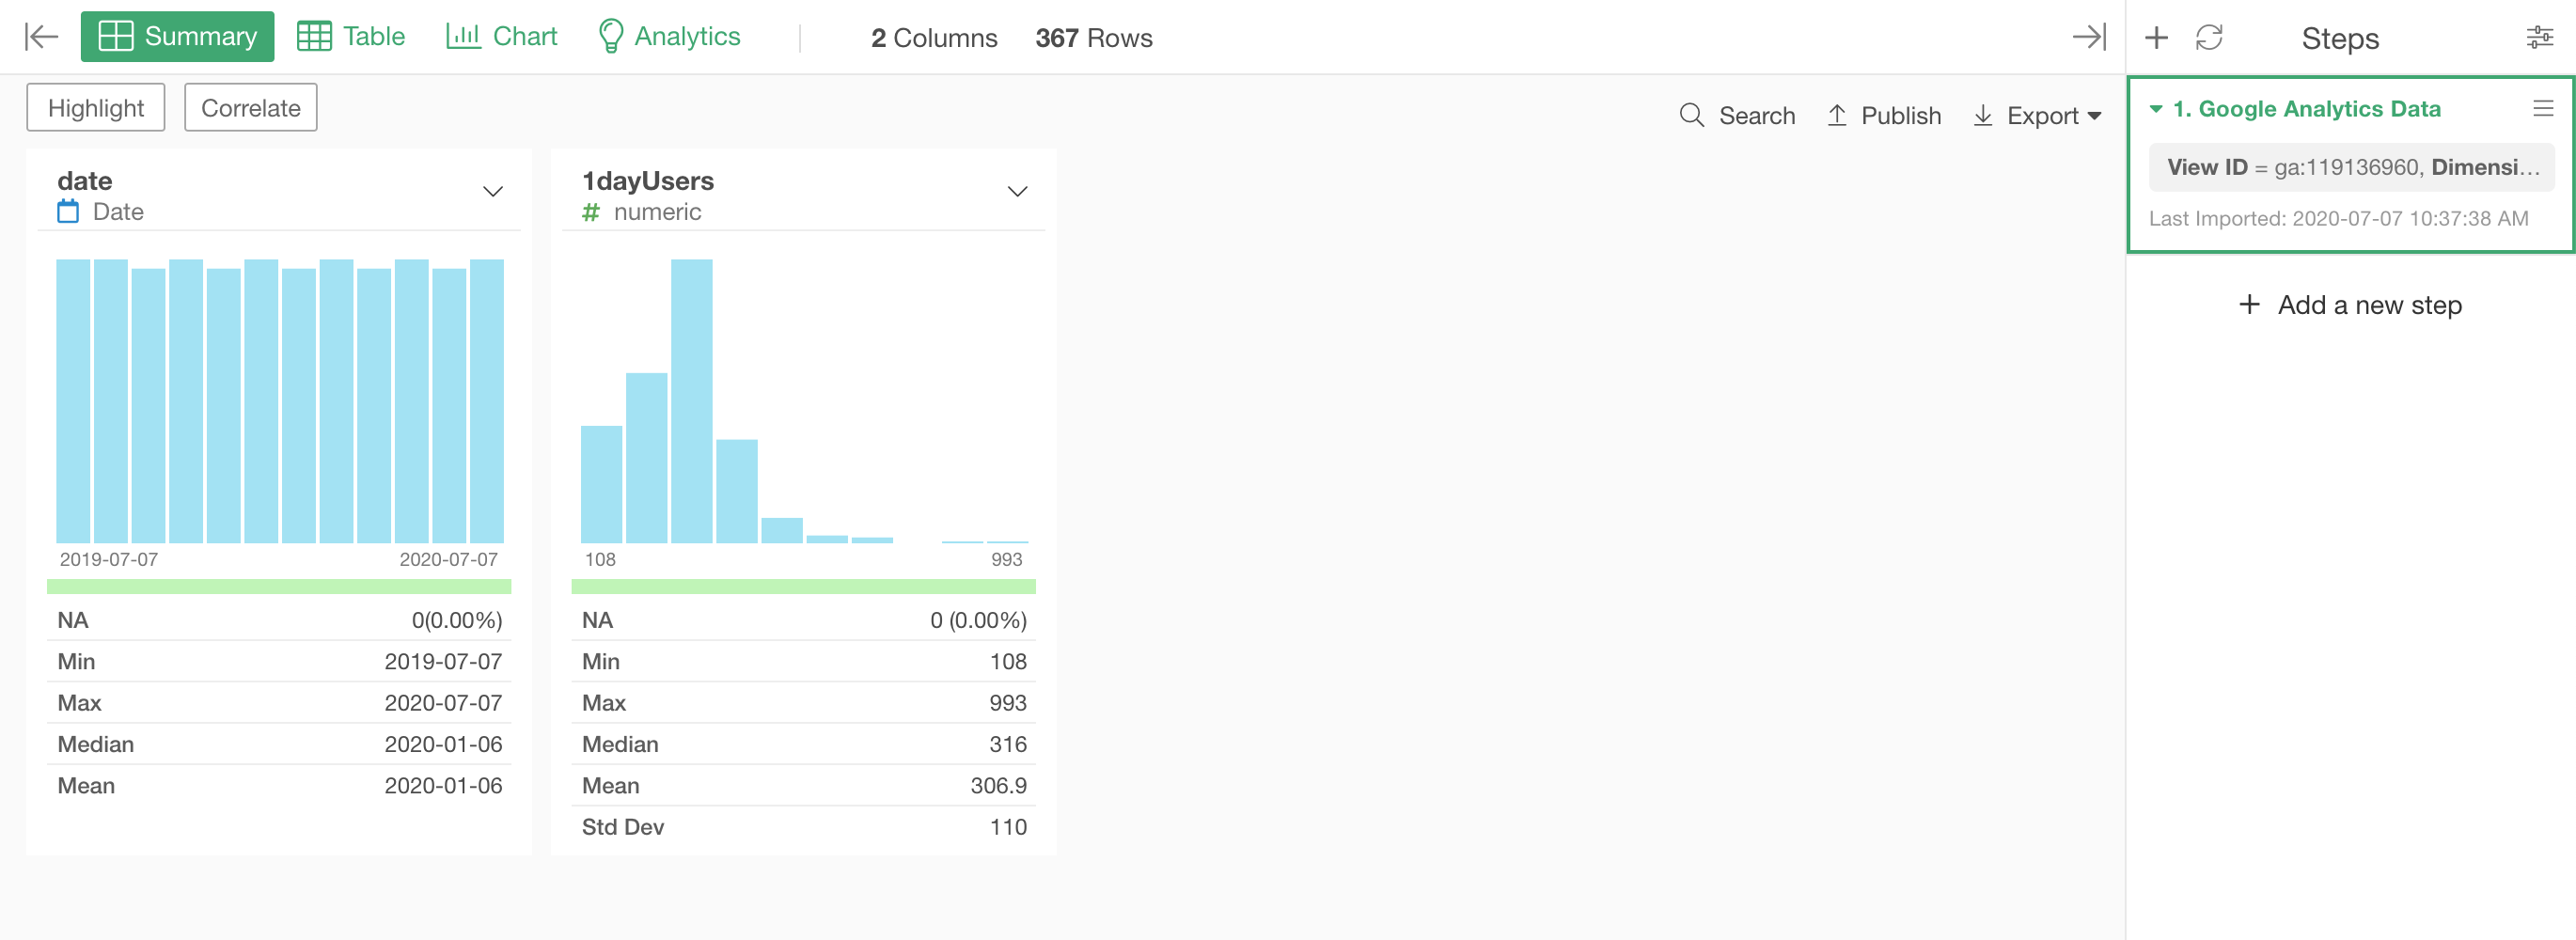
First, let's get the 1 Day Active Users for DAU by selecting only '1 Day Active Users' for the Metric.
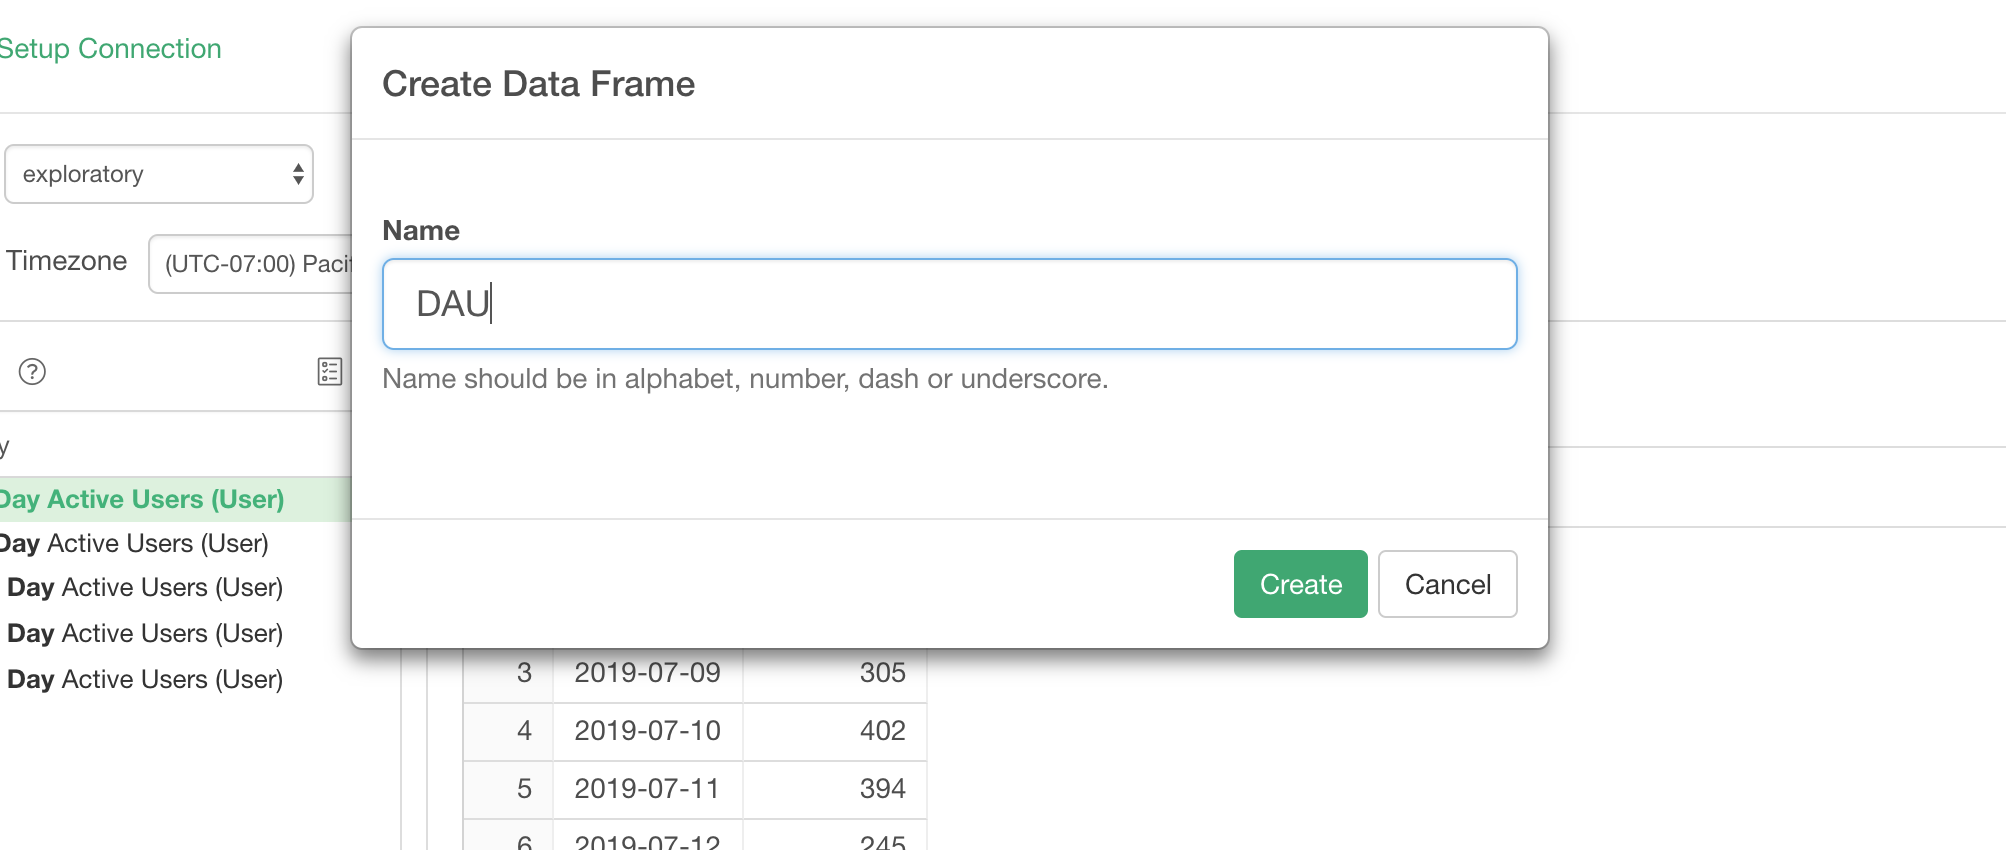
Click 'Save' button, and give 'DAU' as the data frame name.
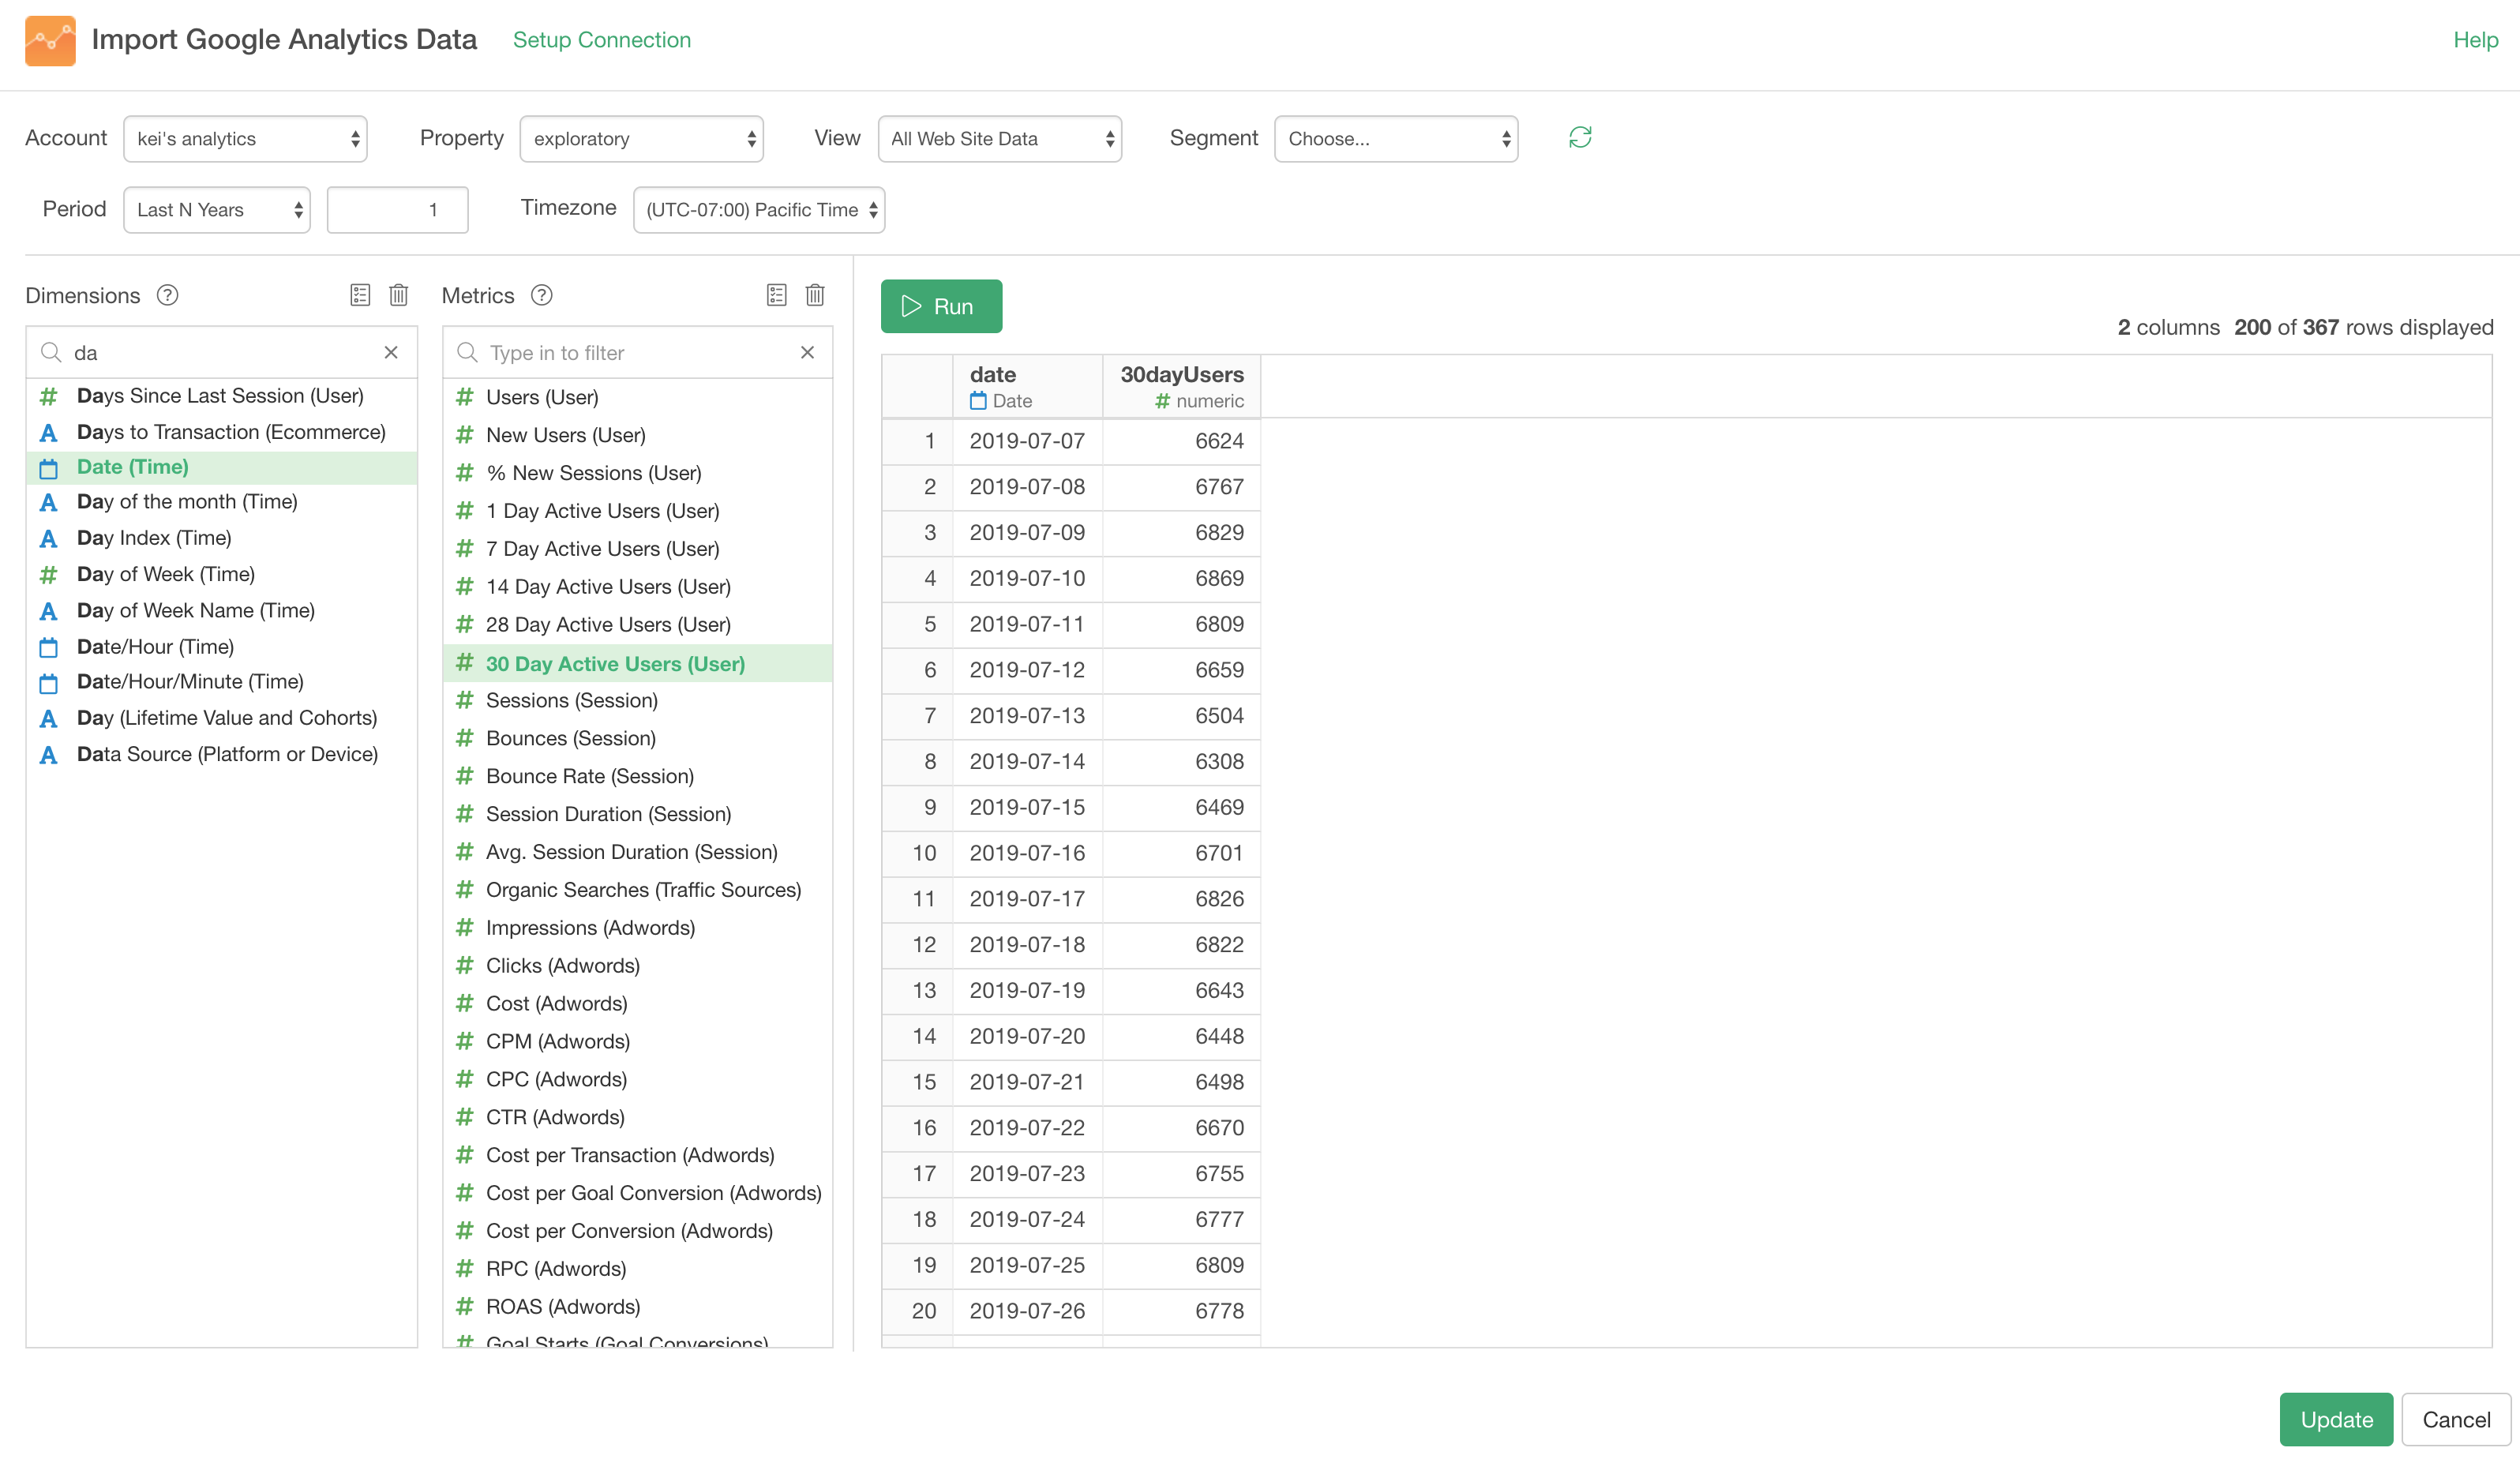
Get 30 Day Active Users for MAU
Now, let's get the 30 Day Active Users for MAU.
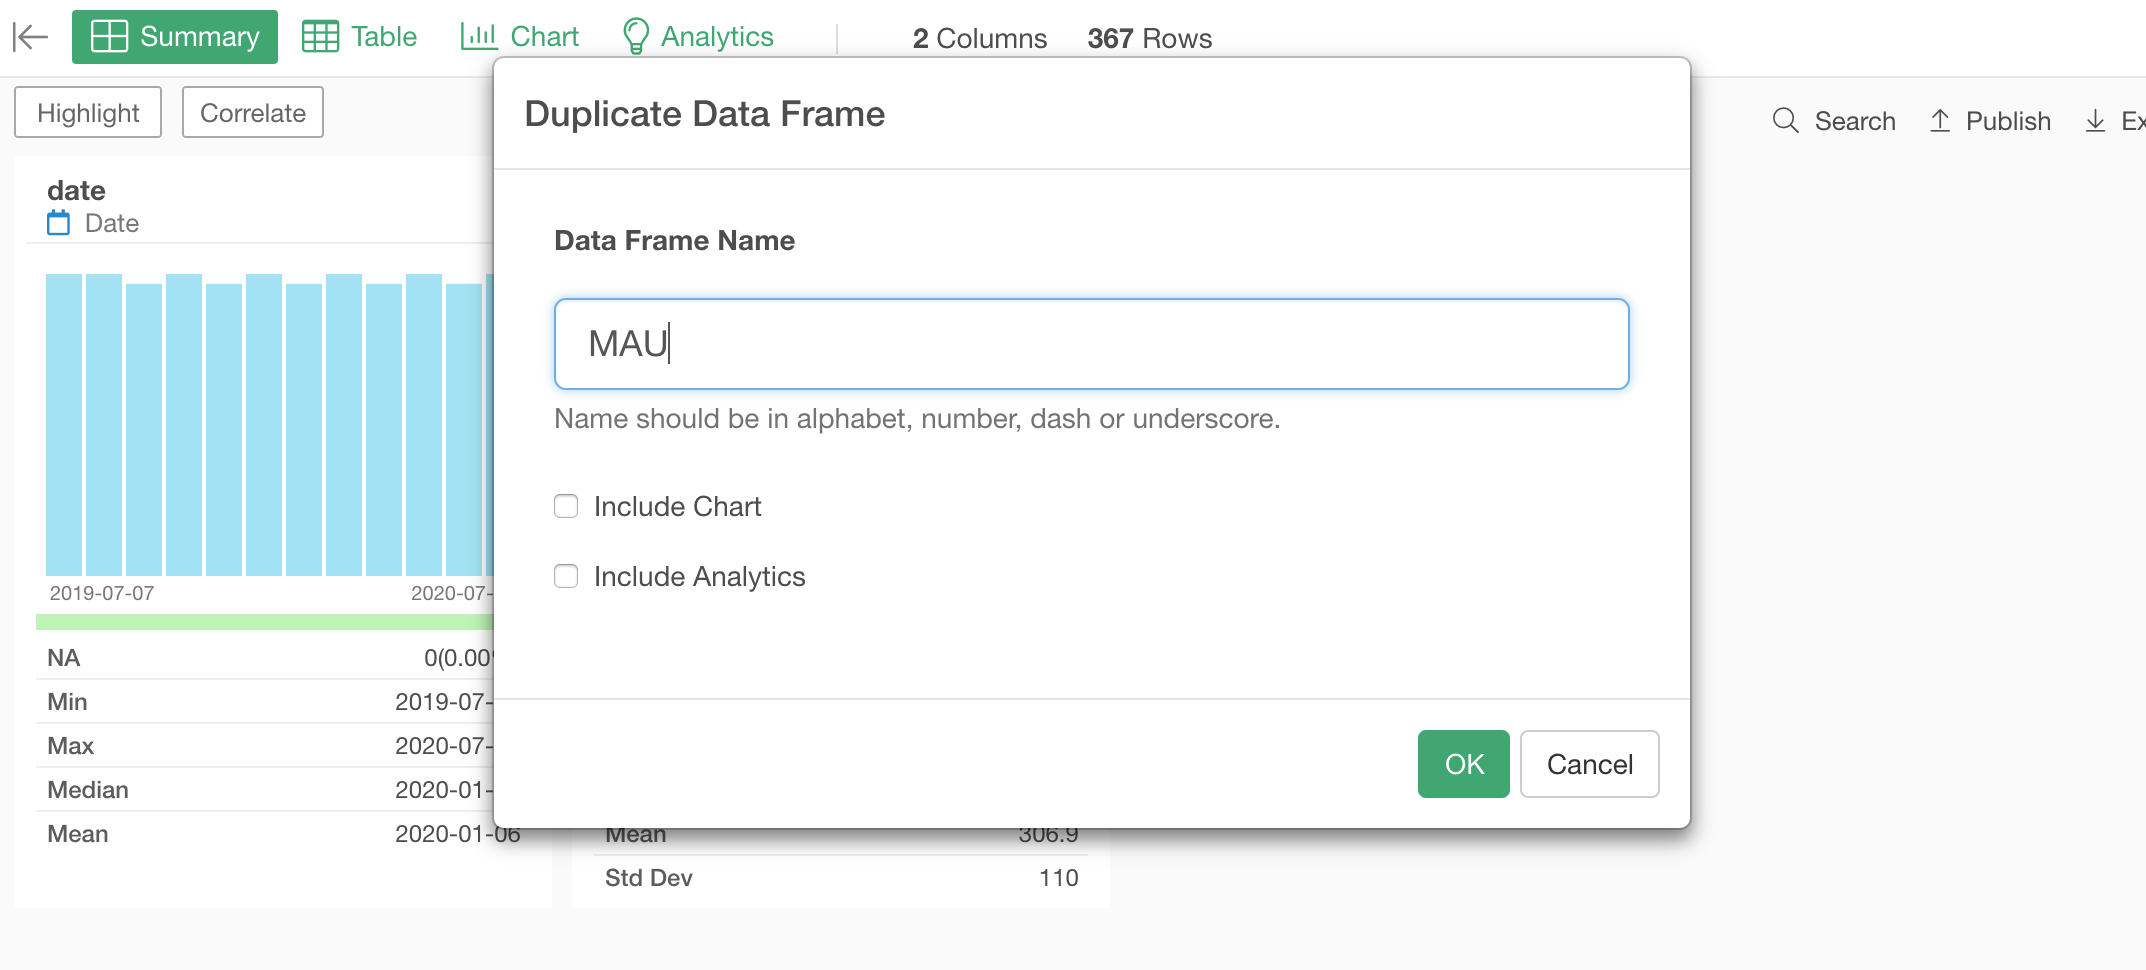
We can start the same process from scratch, but this time let's just copy the DAU data frame then update it for MAU.
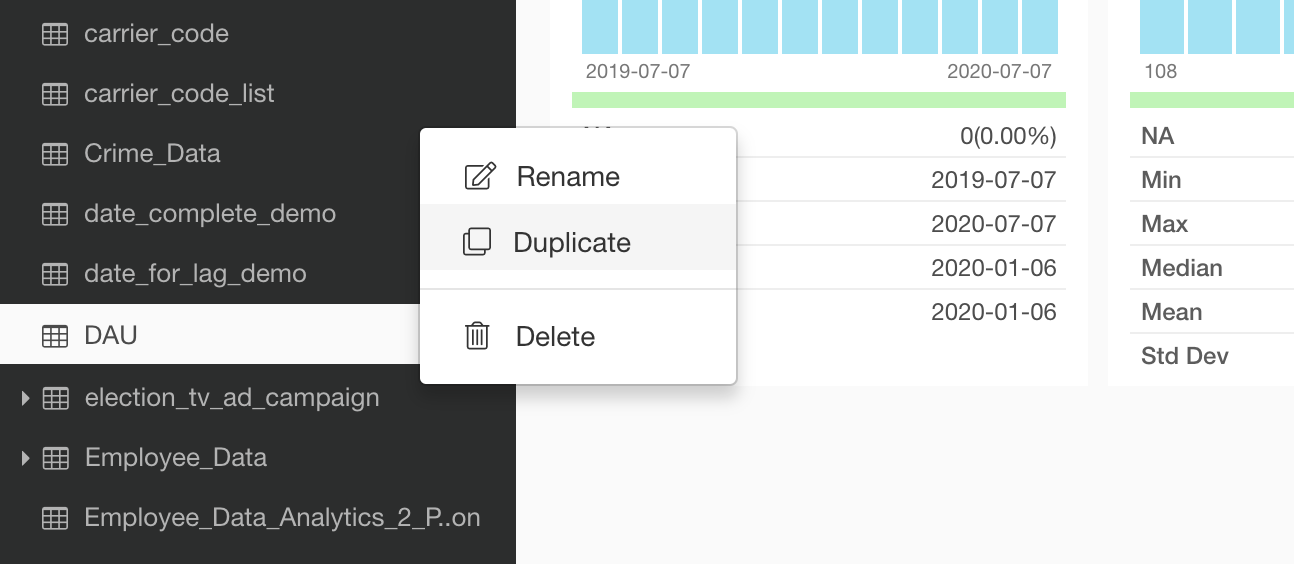
Give a name 'MAU' for this duplicated data frame.
And click on the token inside the data source step to open the Google Analytics data import dialog to edit the query.
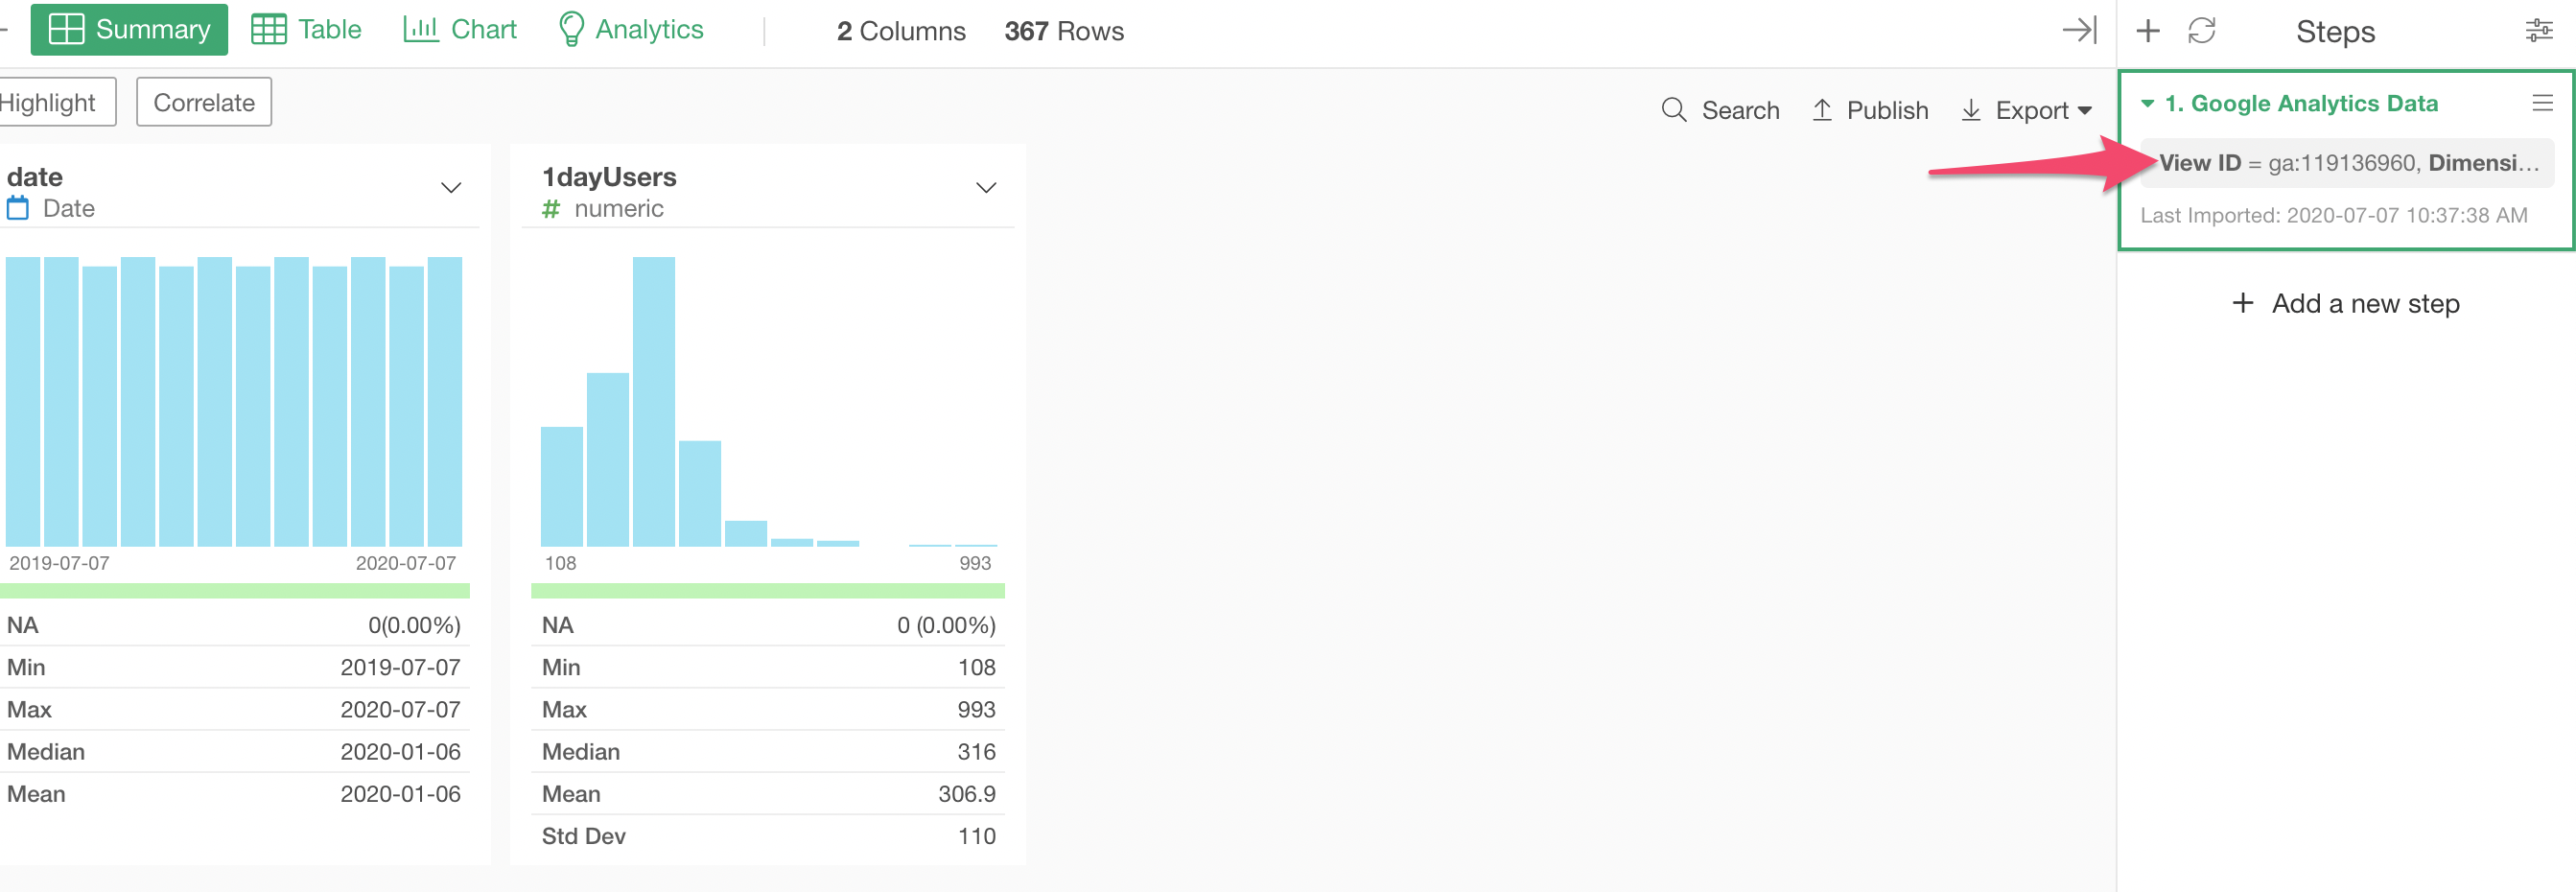
And this time, we want to select '30 Day Active Users' for the Metric.
Now we have both DAU and MAU data. It's time to join them together so that we can calculate the DAU / MAU!
2. Join DAU and MAU Data
Go back to the DAU data frame. (you can do this either at the DAU data frame or at the MAU data frame. It doesn't matter really, but I'll use the DAU data frame here.)
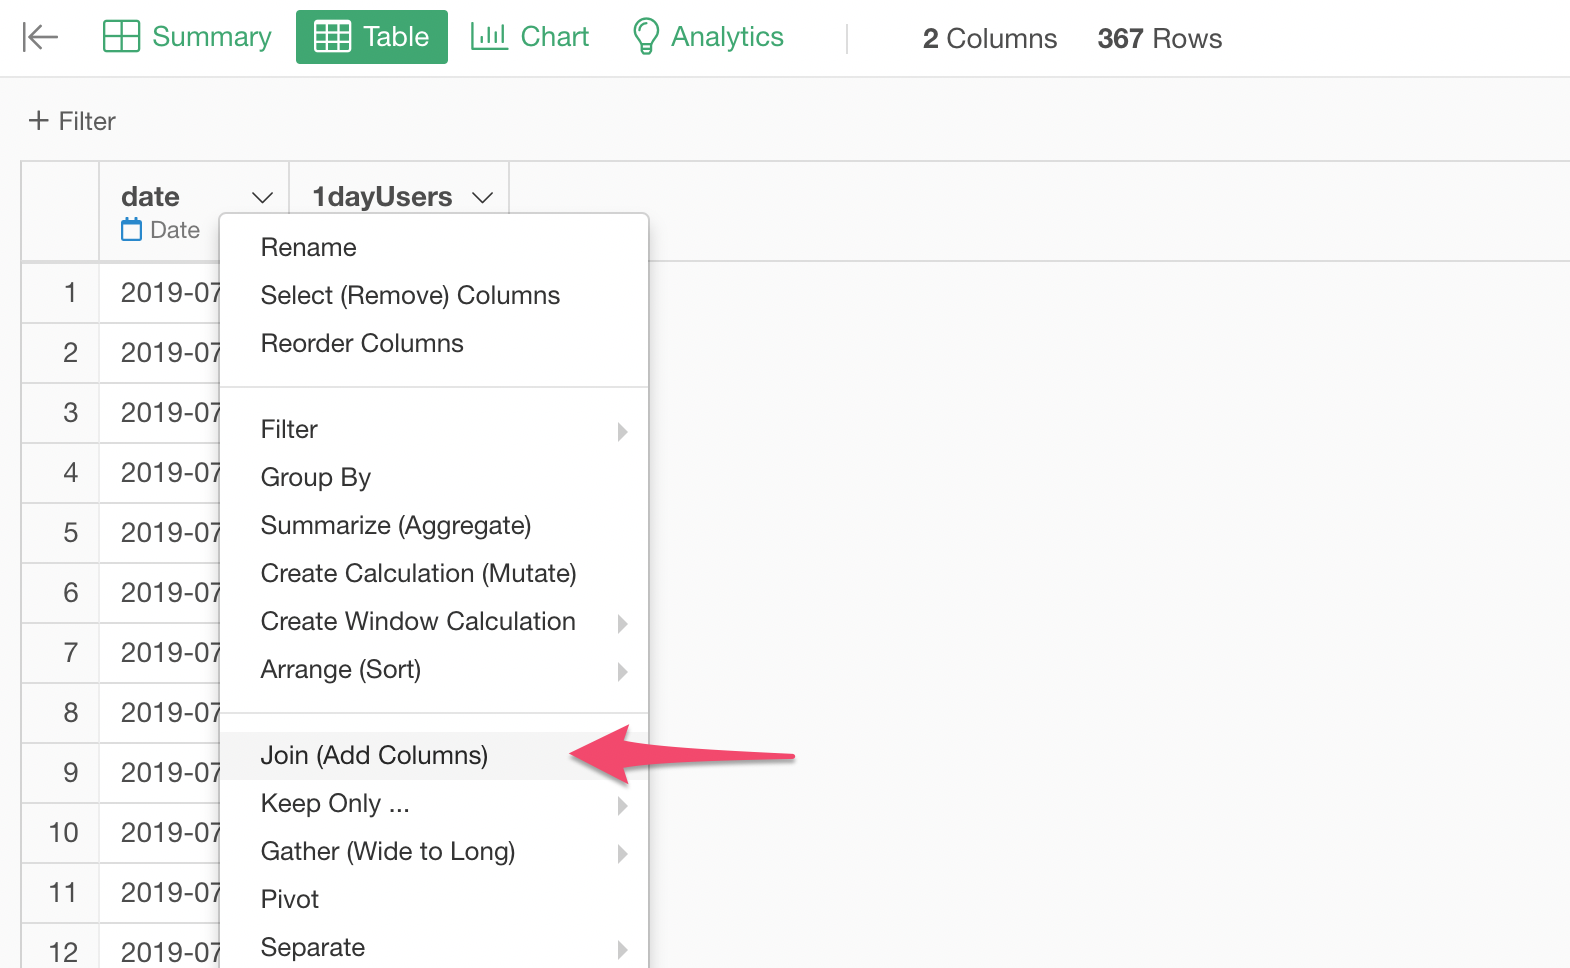
We want to use the 'date' column as the key column to join the two data frames together, so select 'Join' from the column header menu of the 'date' column.
Inside the Join dialog, select the 'MAU' data frame and the 'date' column as the key column.
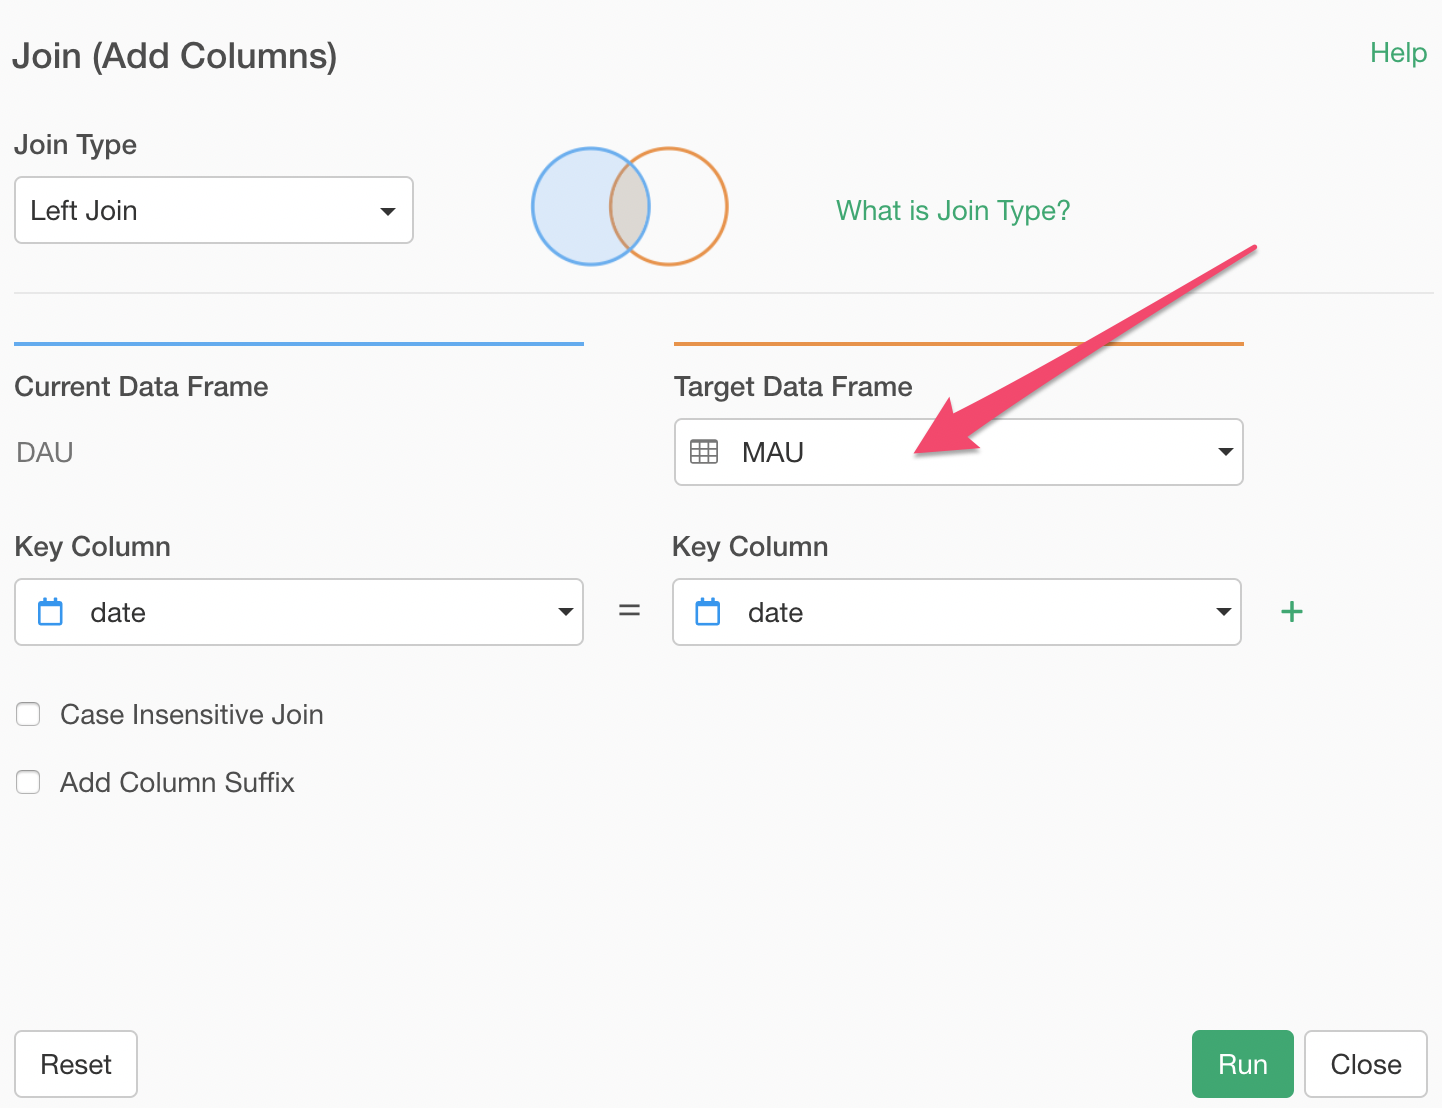
Once you click the 'OK' button, you'll see the two data frames joined together.
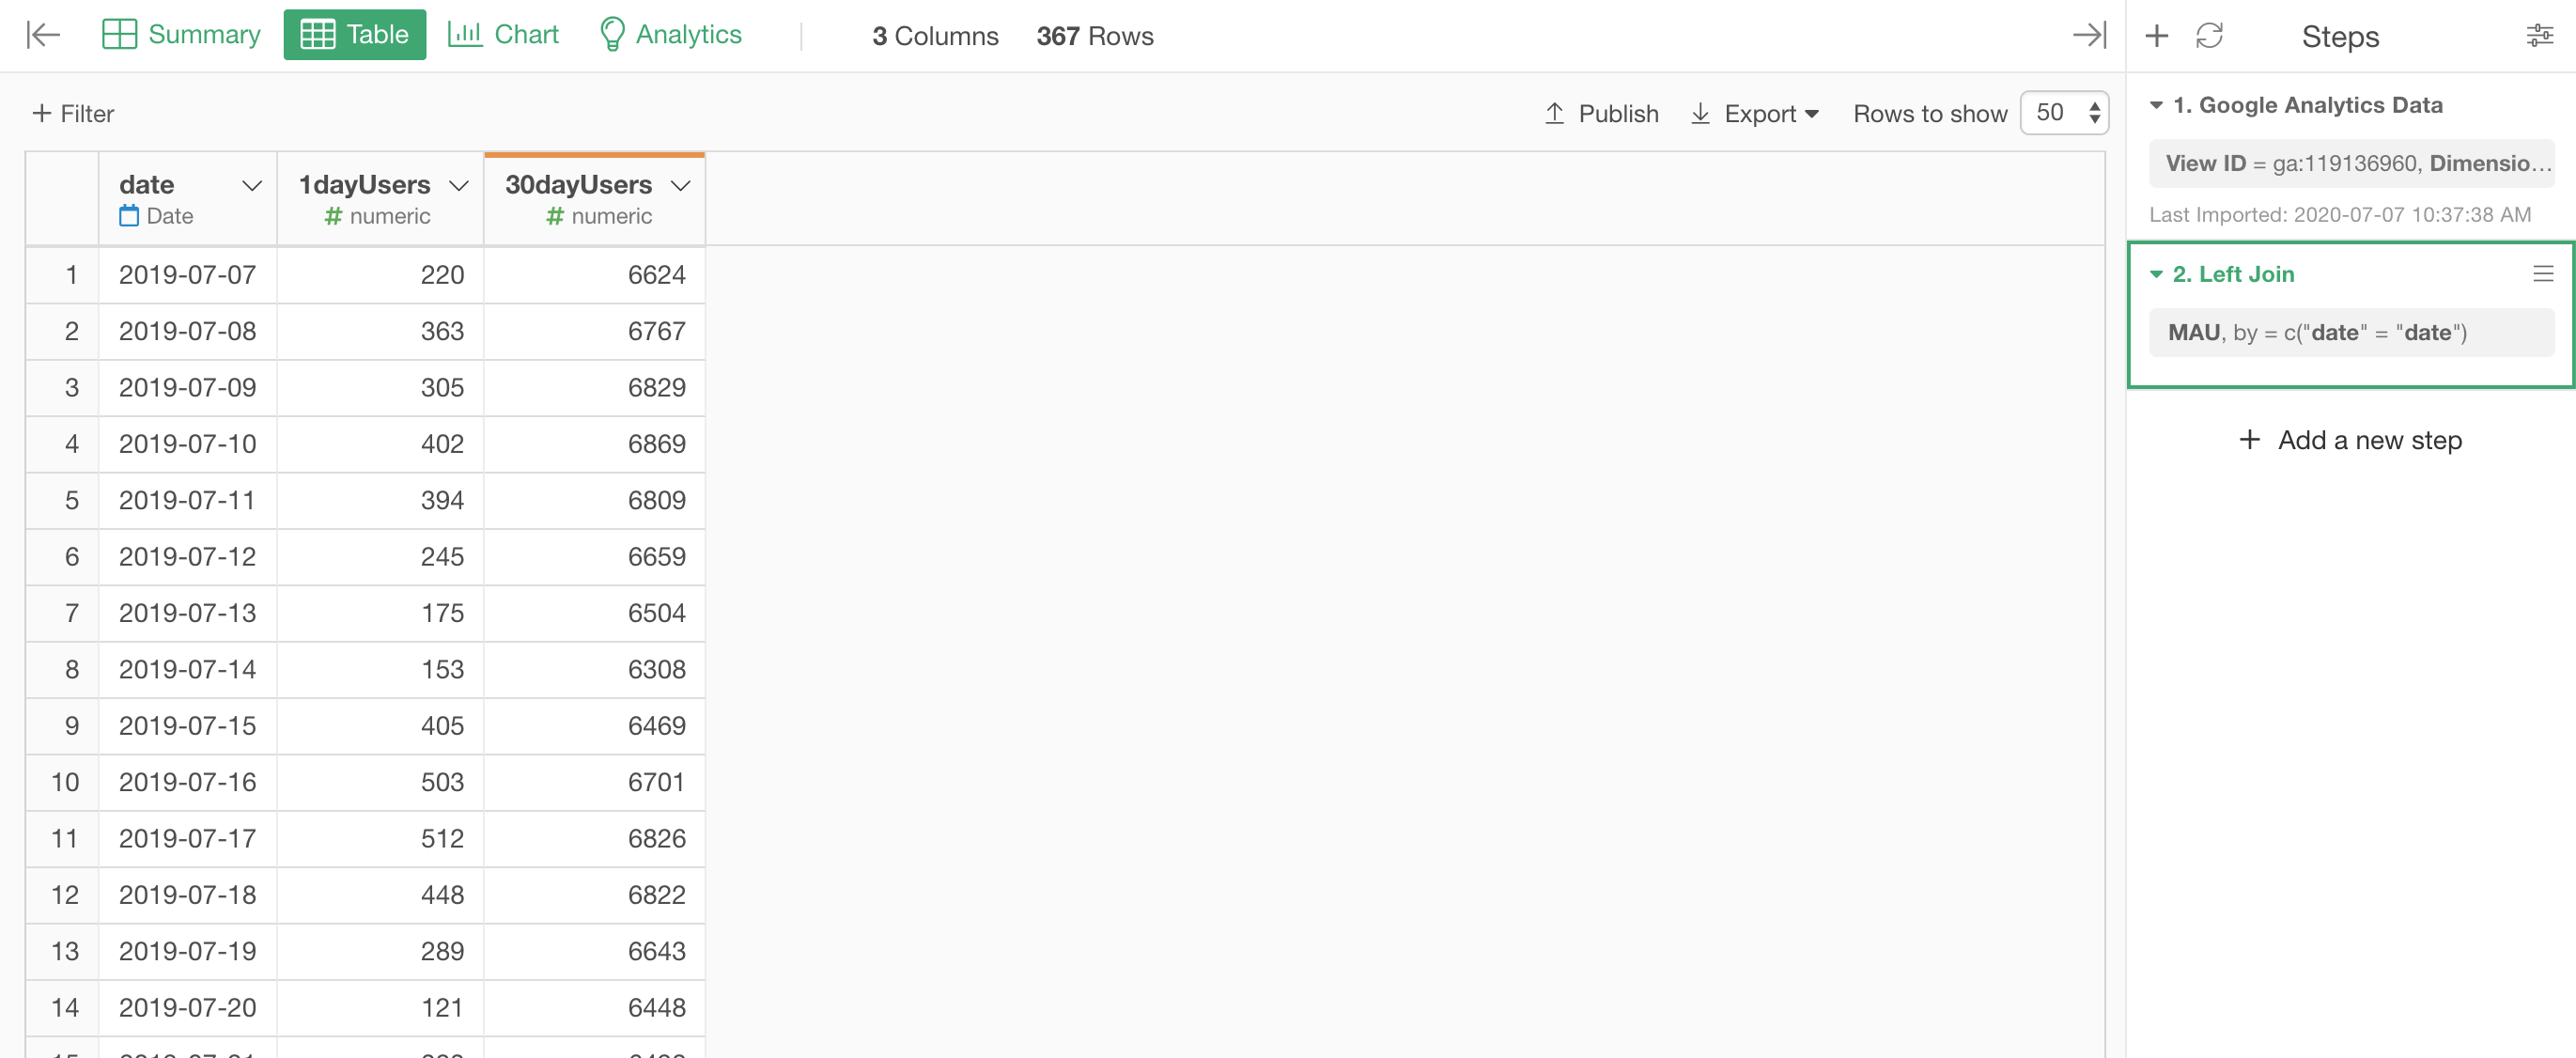
Now, we are ready to calculate the DAU / MAU!
3. Calculate DAU / MAU
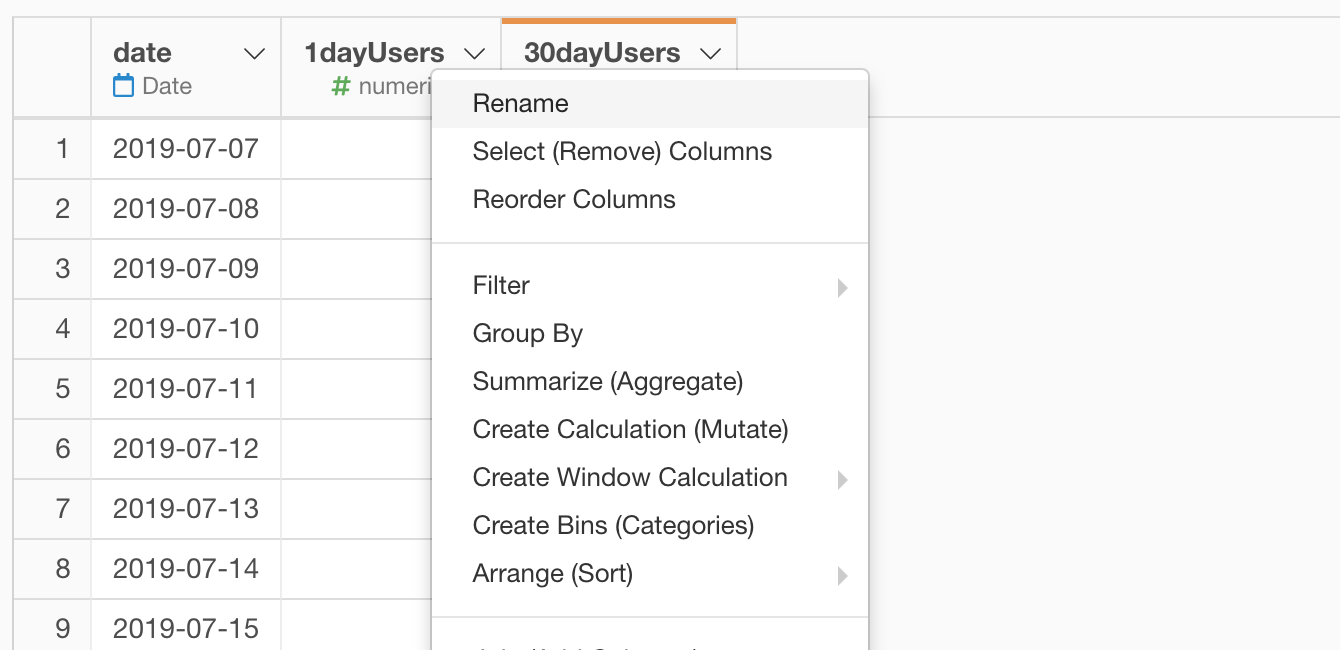
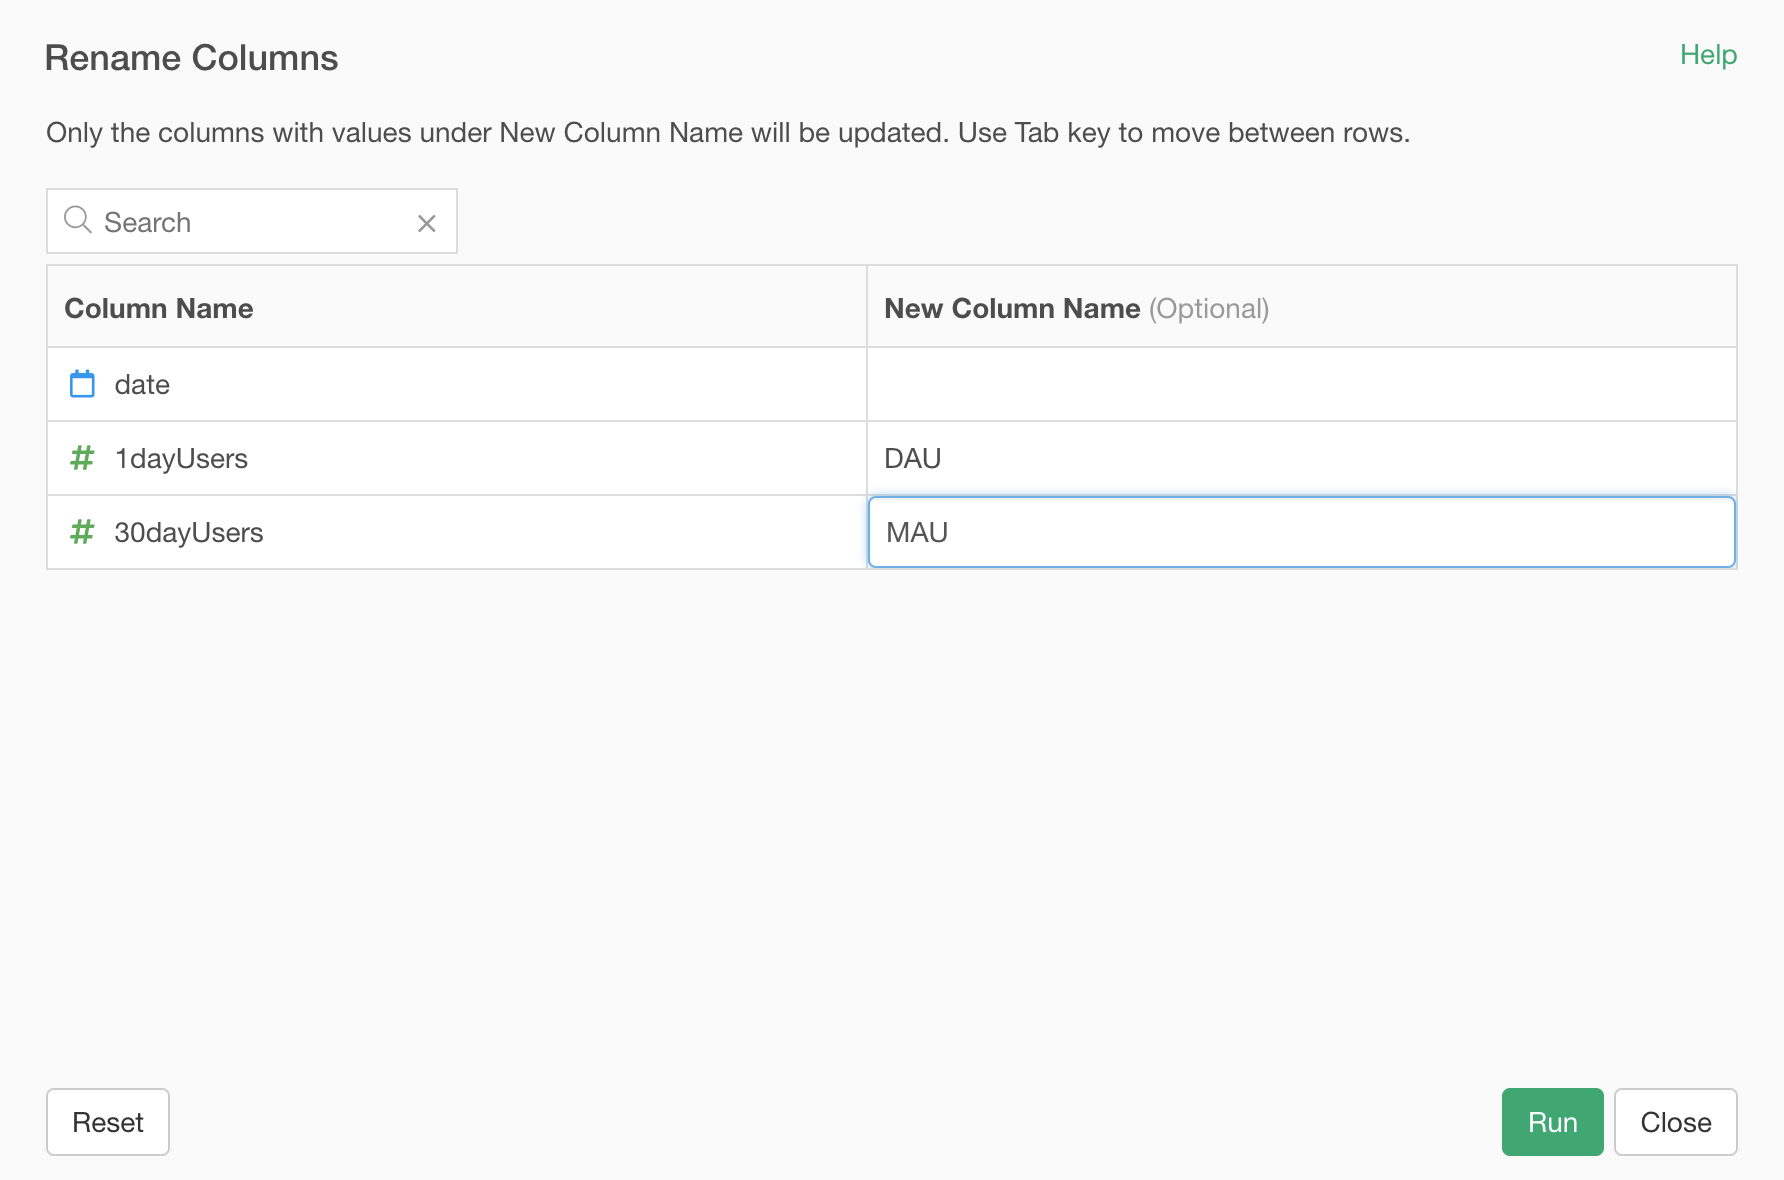
Before we do the calculation, let's change the column names to 'DAU' and 'MAU' to make them easier to identify what they are.
Select 'Rename' from the column header menu.
Update the column names and run it.
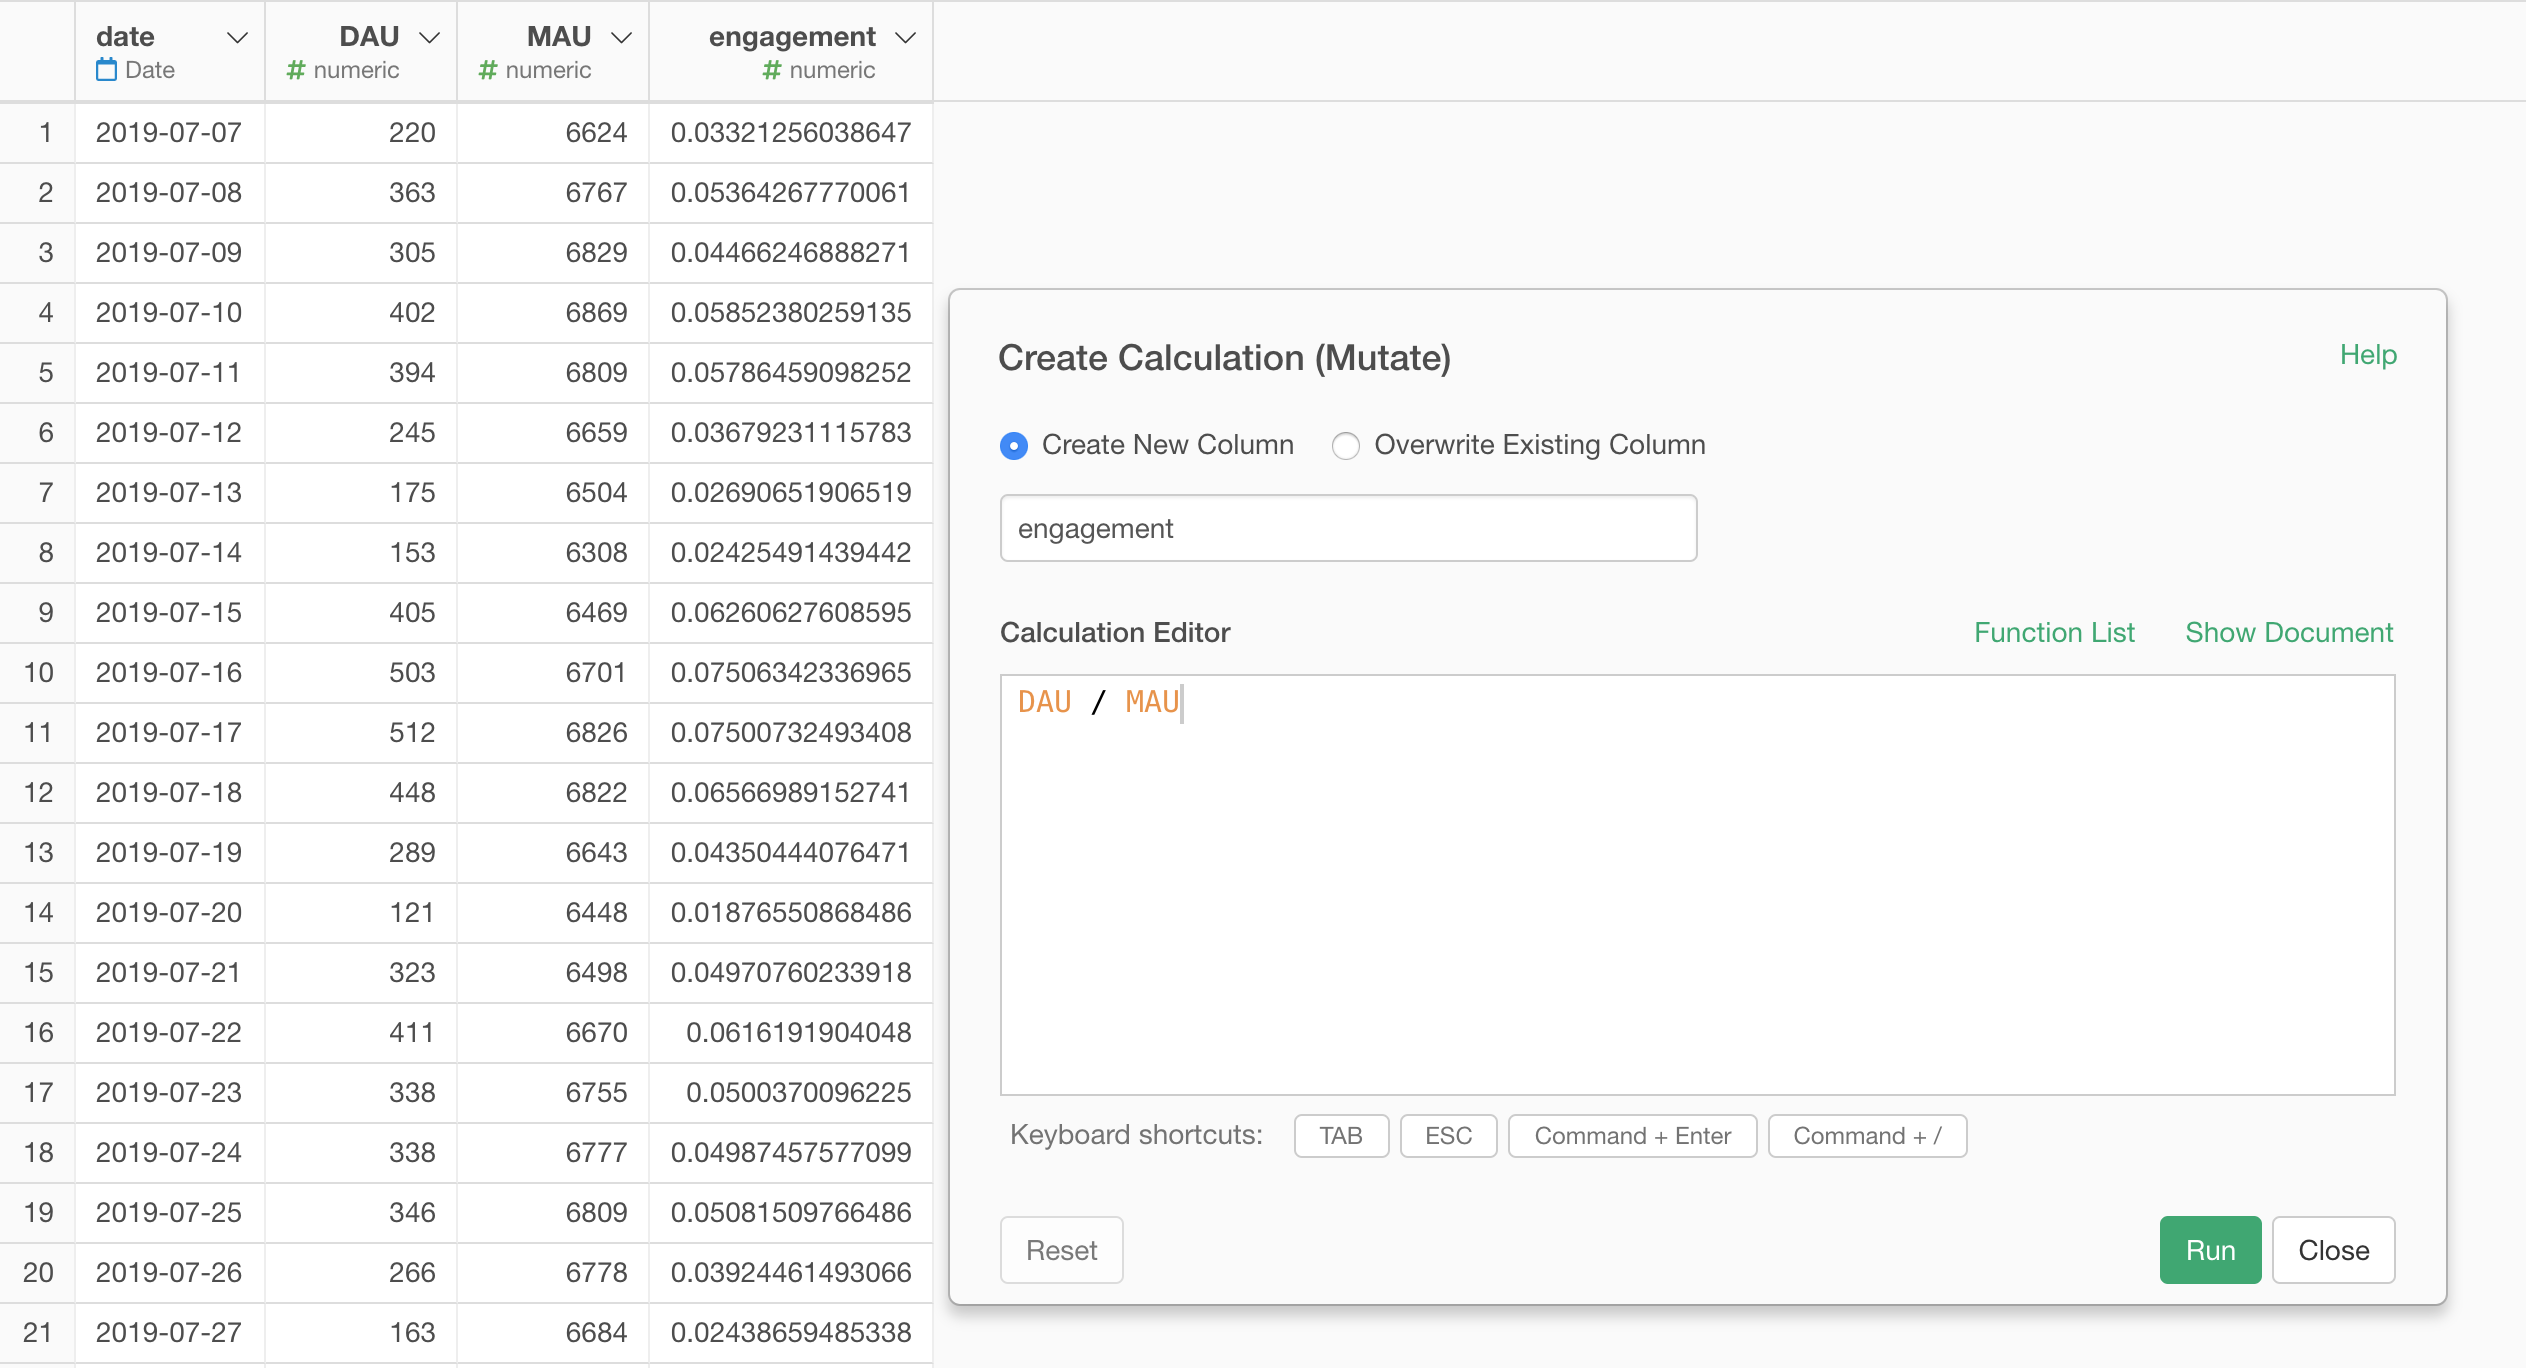
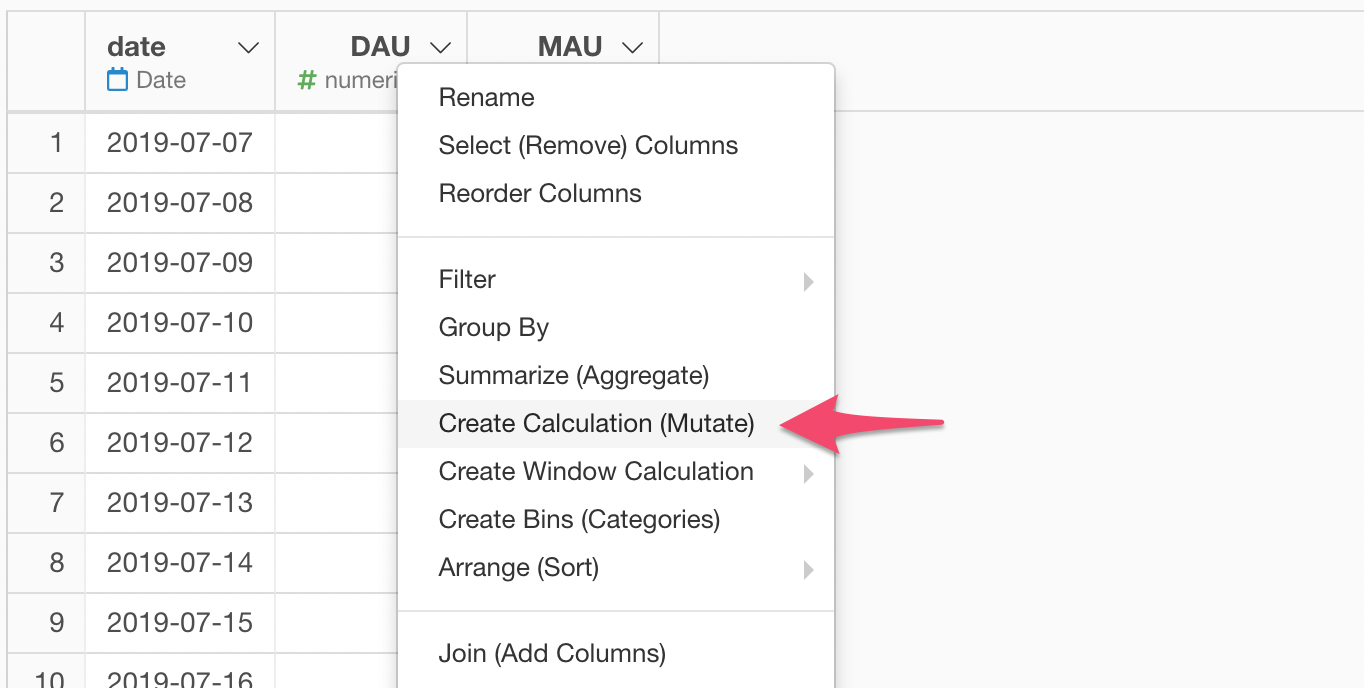
Now, let's create the calculation for DAU / MAU.
Select 'Create Calculation (Mutate)' from the column header menu.
Inside the 'Create Calculation' dialog, type the following calculation.
DAU / MAU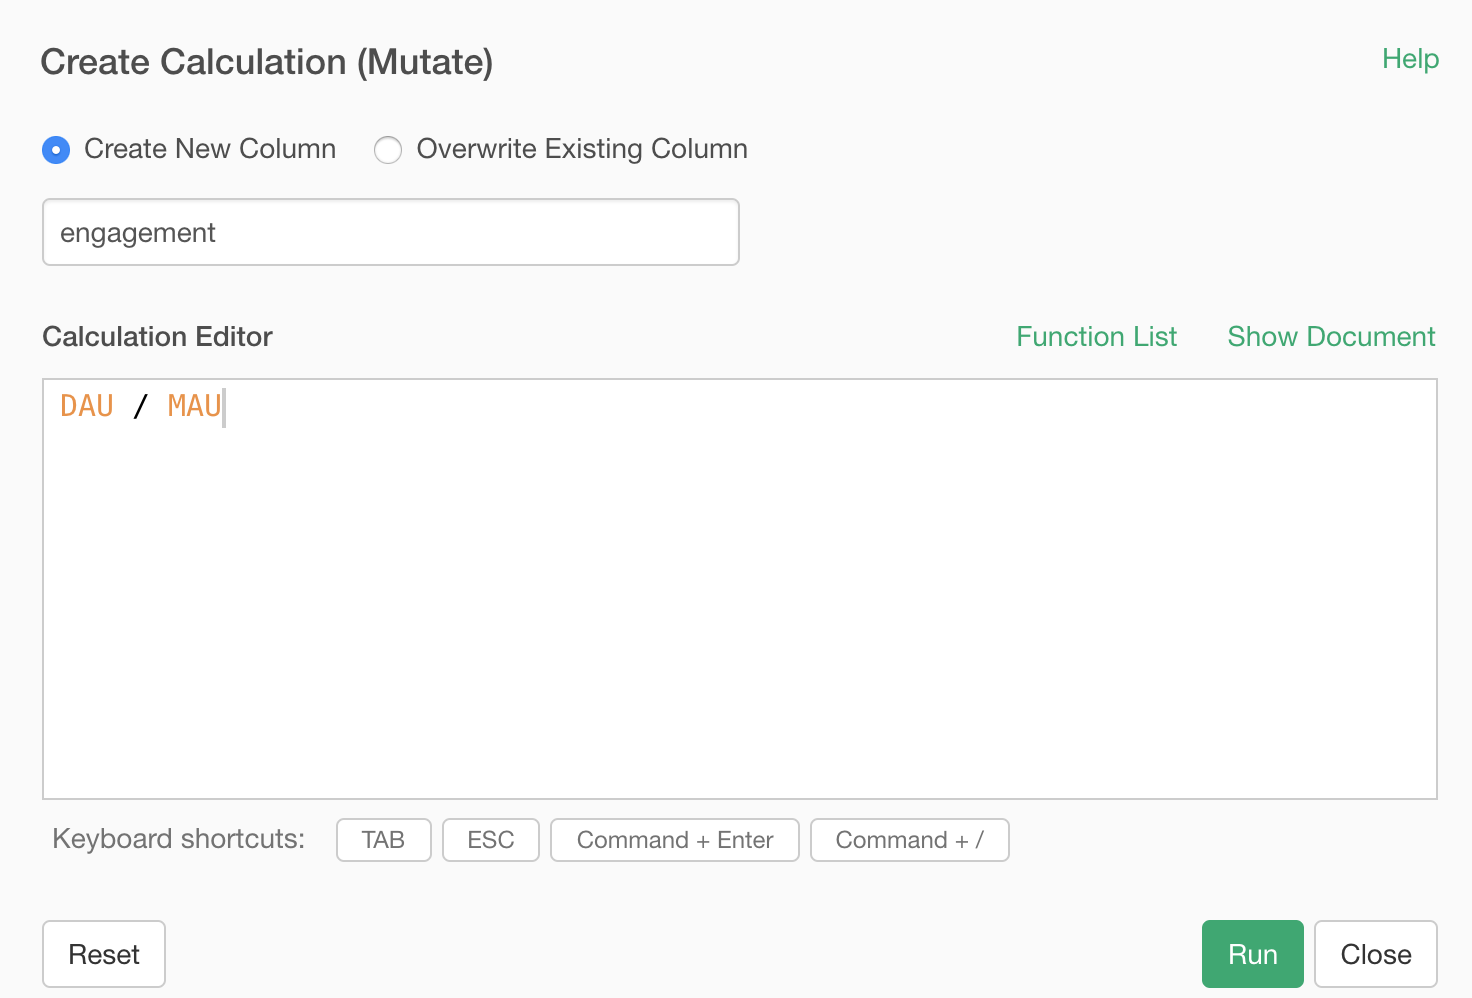
We can name the newly calculated column to be 'engagement', and click the OK button to run it.
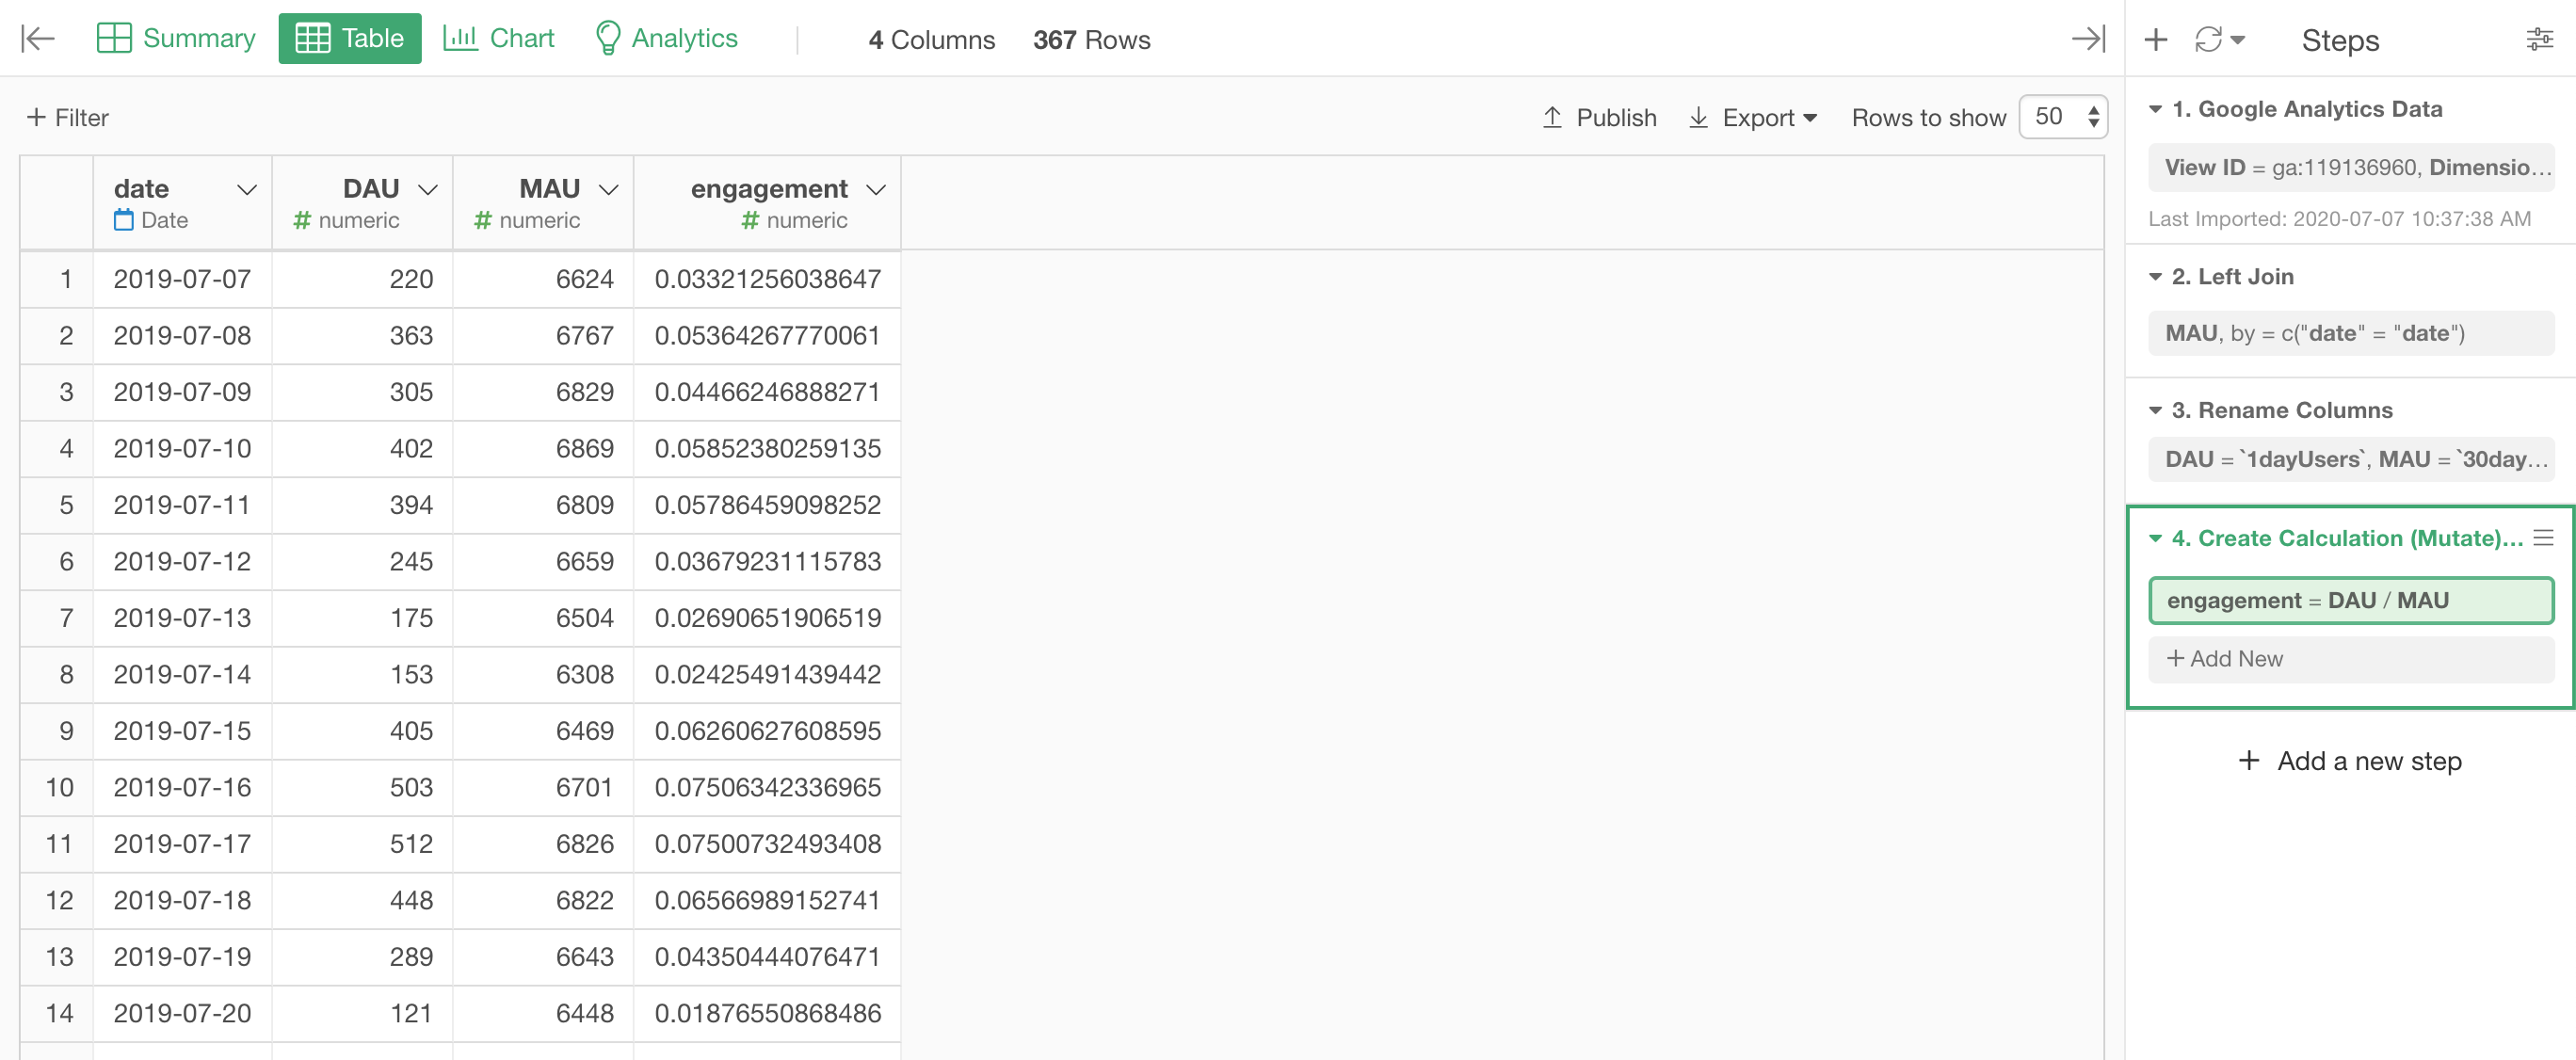
Now that we have calculated the DAU/MAU, let's visualize the trend.
4. Visualize DAU/MAU Trend
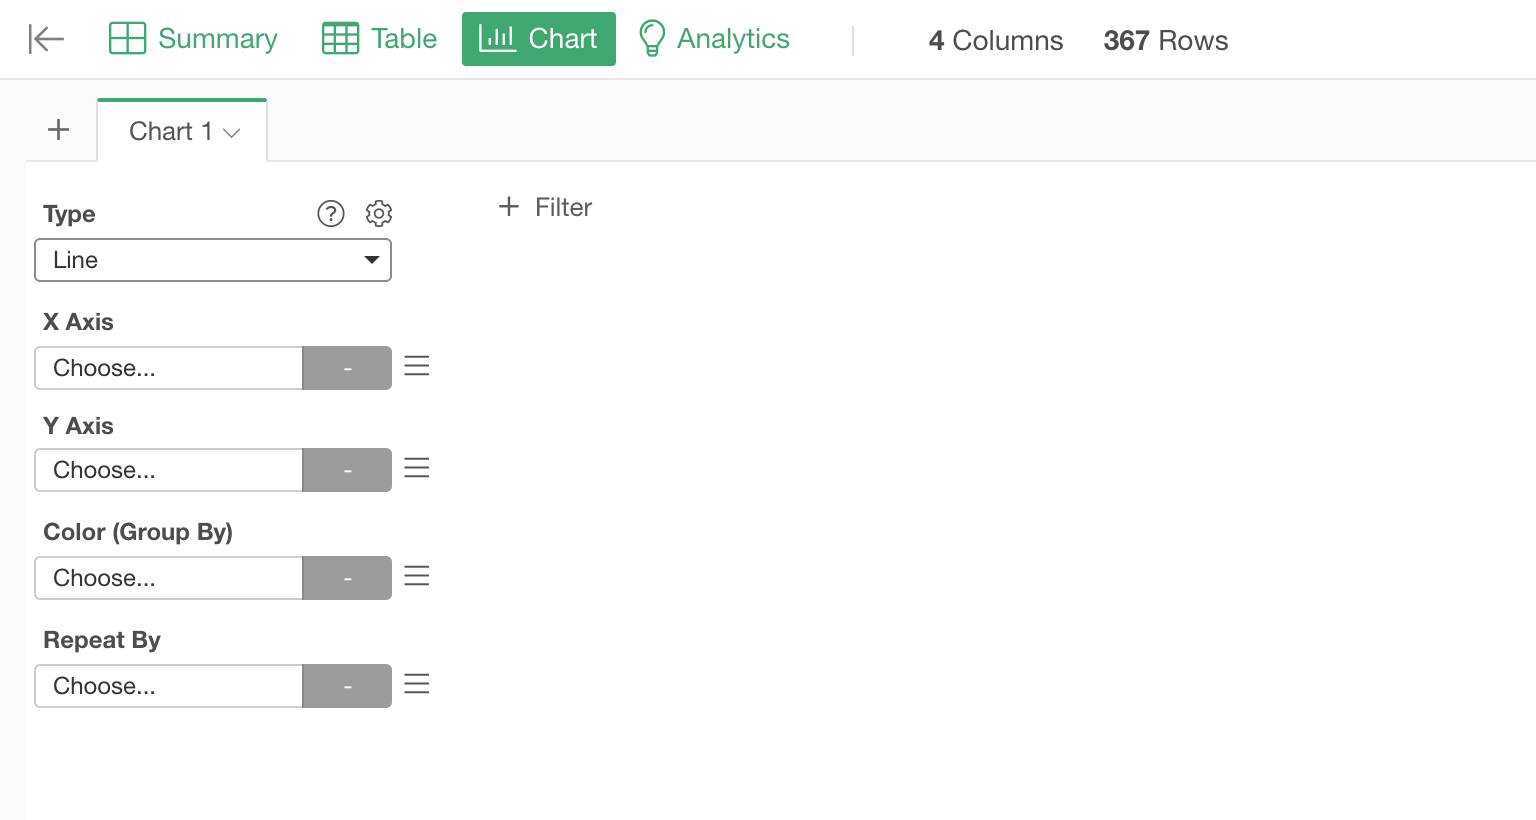
Go to the Chart view and select the 'Line' chart.
Select the 'date' column for the X-Axis and select 'Day' as the aggregation level.
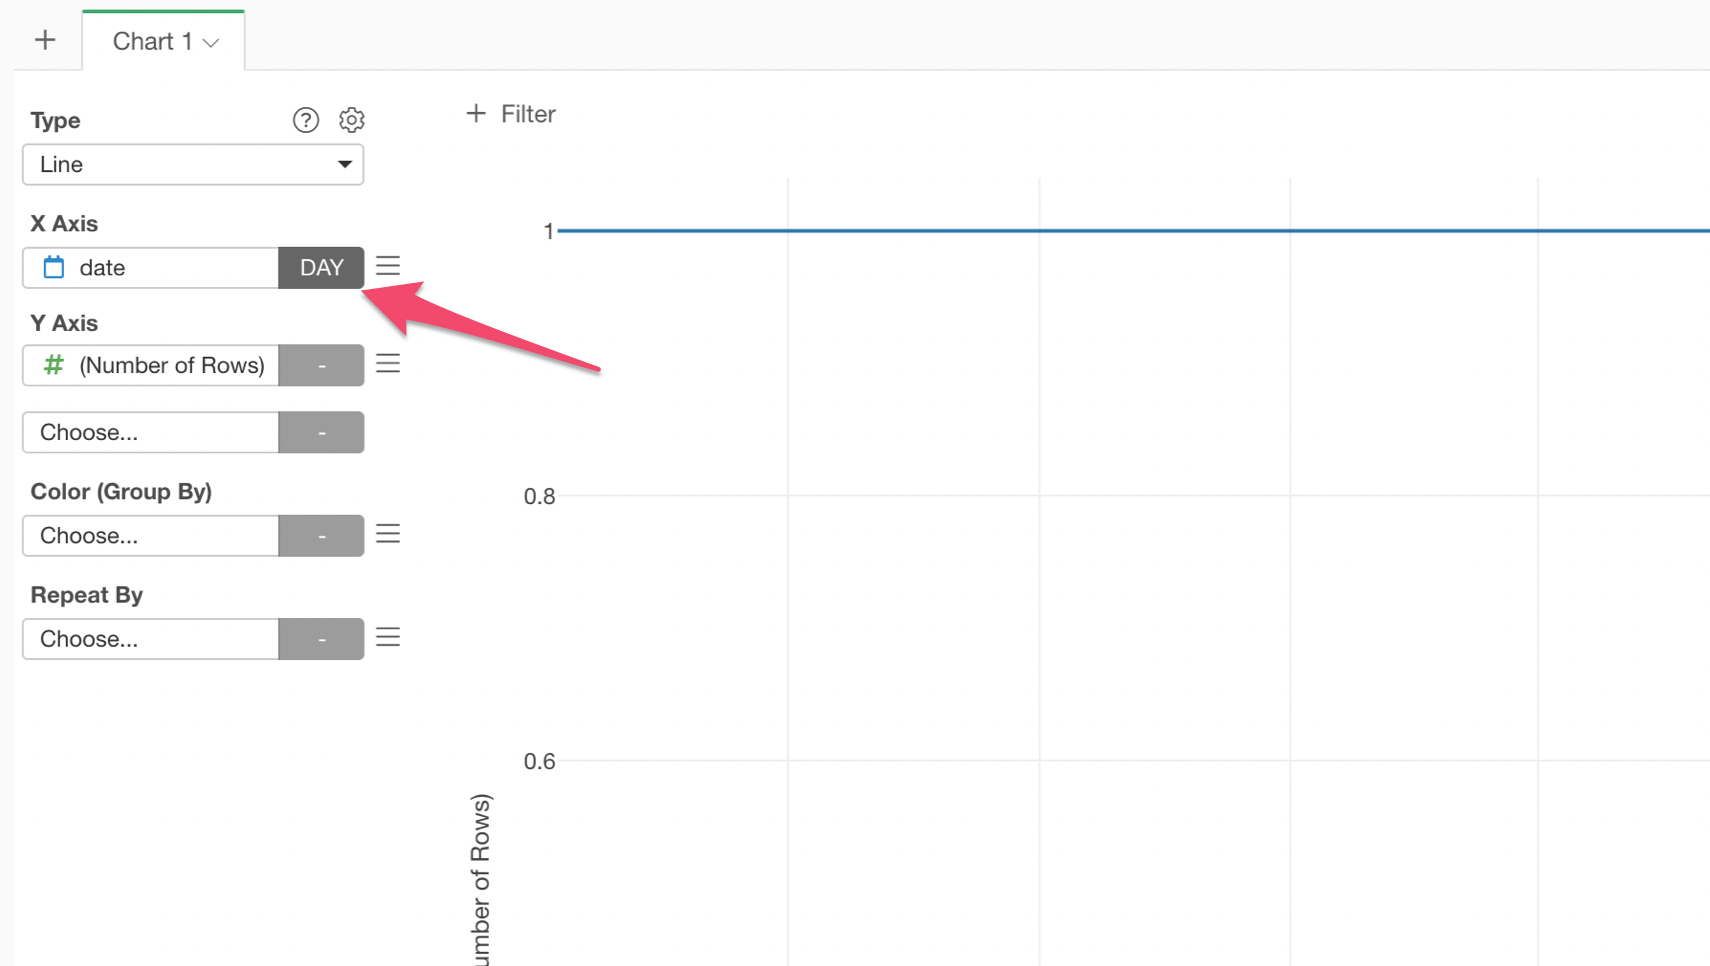
And select the 'engagement' column for the Y-Axis.
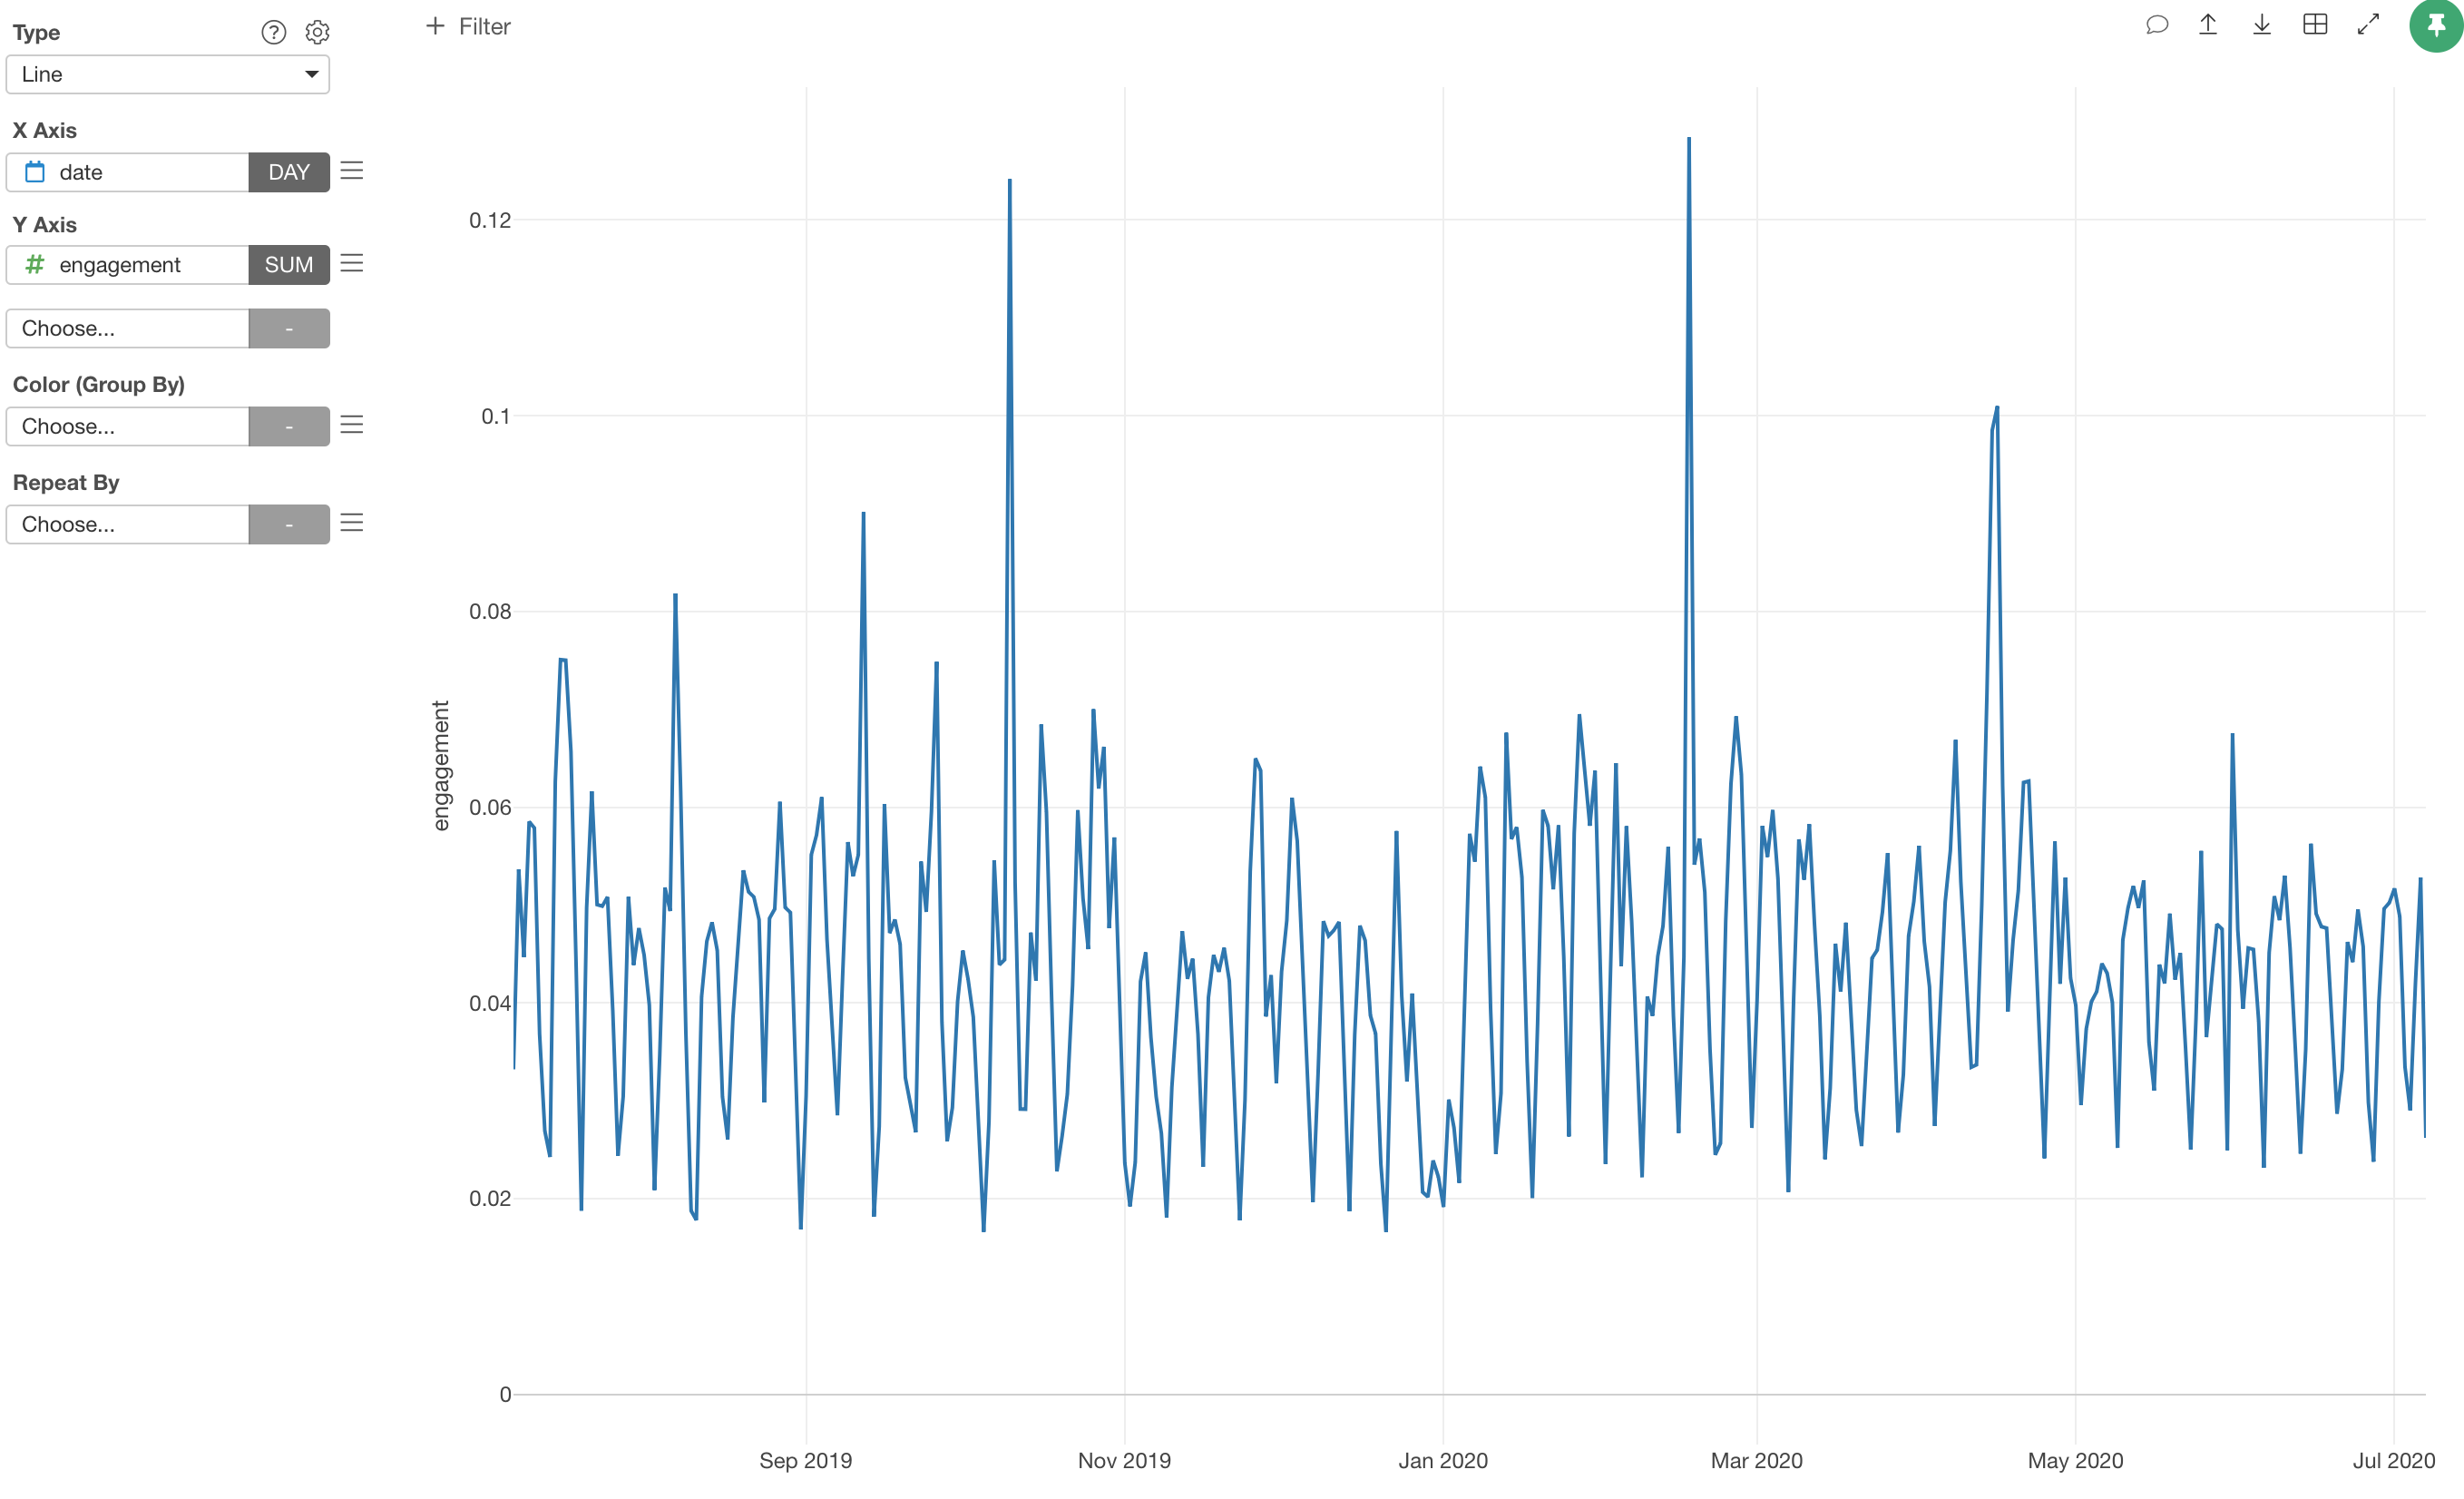
That's it!