Missing Values (NA) Handling in Chart
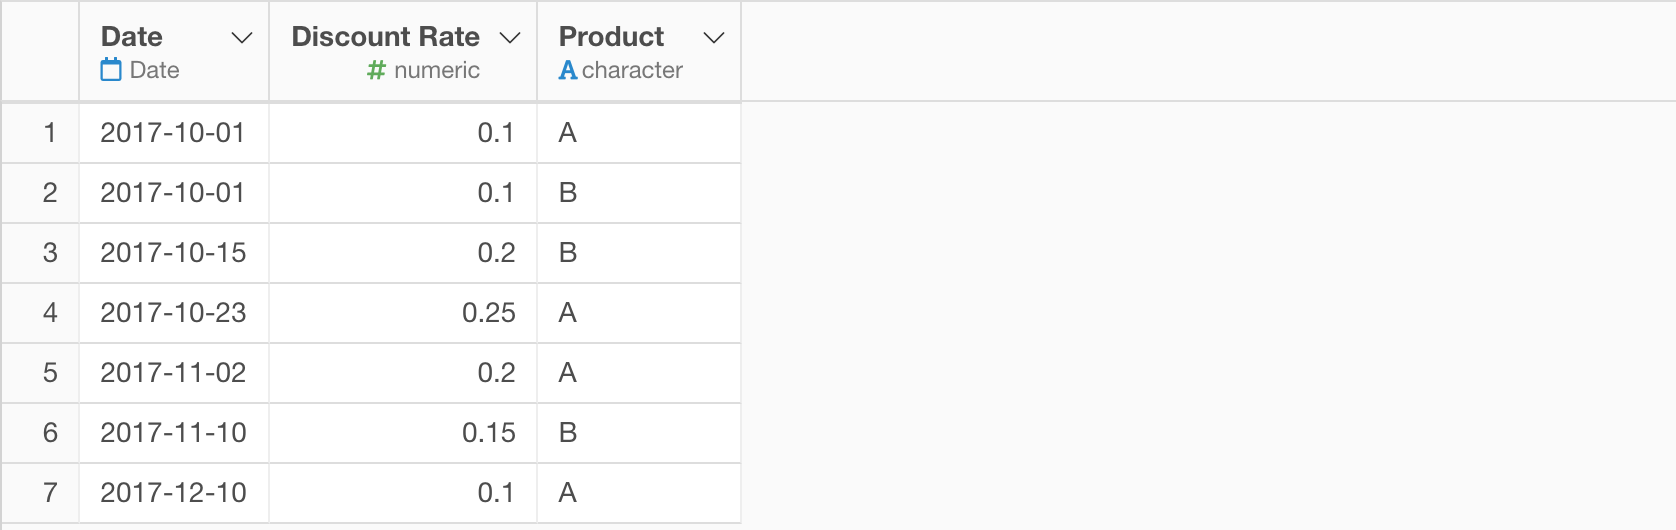
Let’s say we have a discount rate changes data that have only the dates when the discount rates were changed.
If we visualize this with Line chart you’ll get something like this.
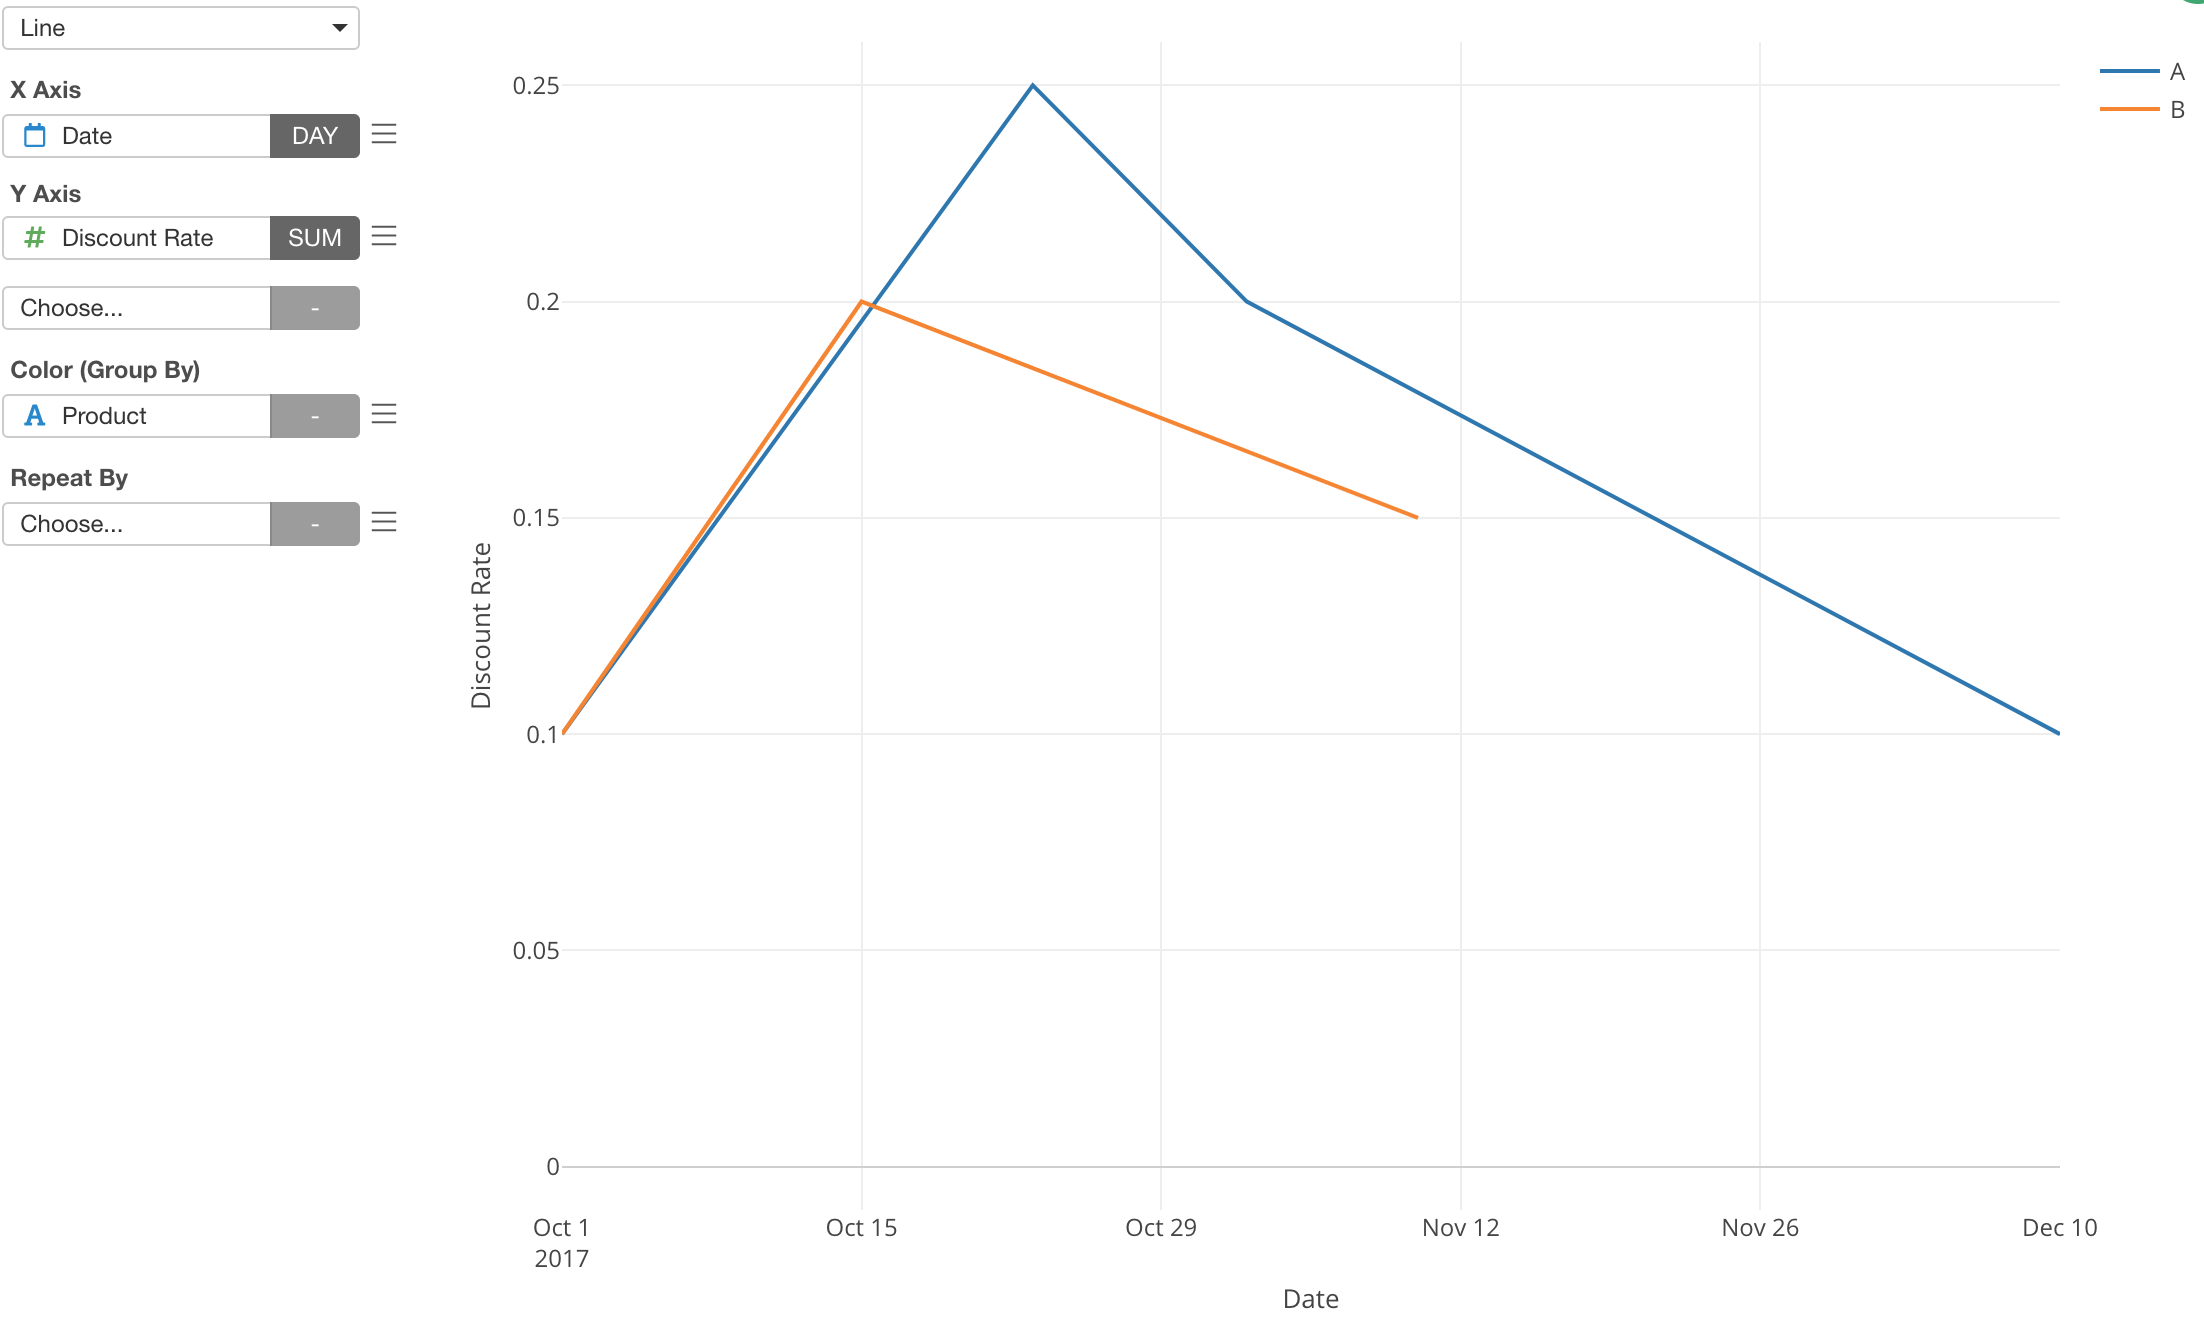
This is misleading because we know the discount rates were not changing gradually between the change dates.
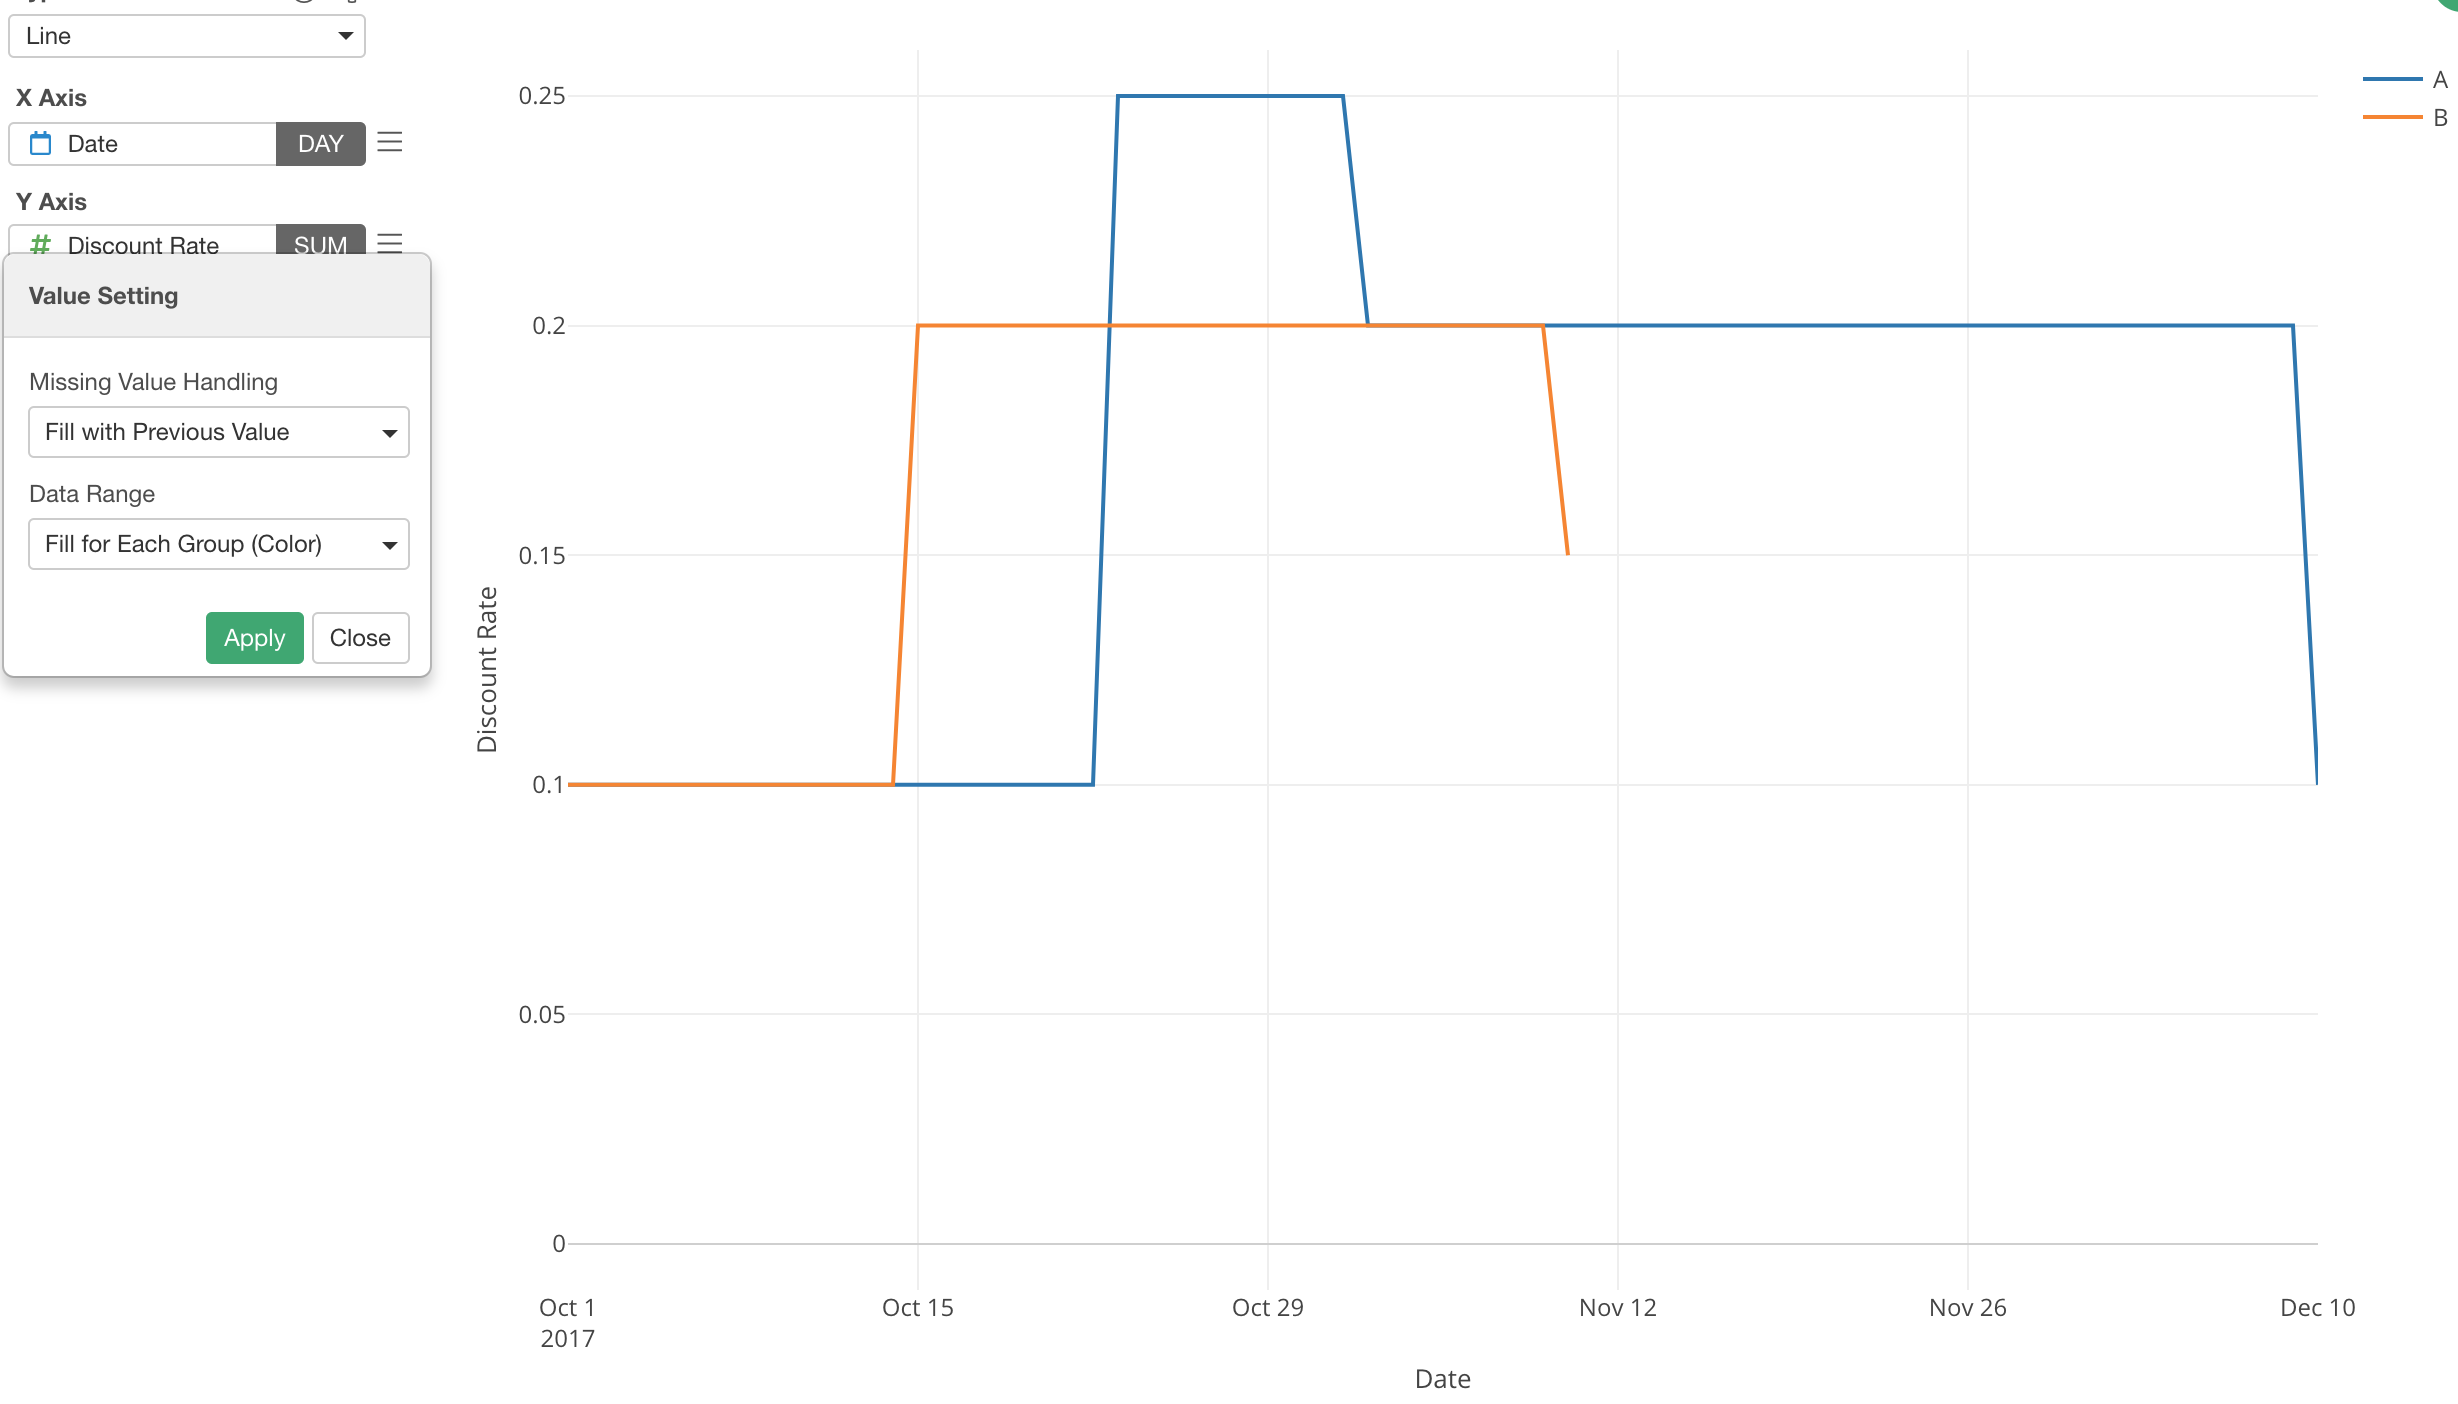
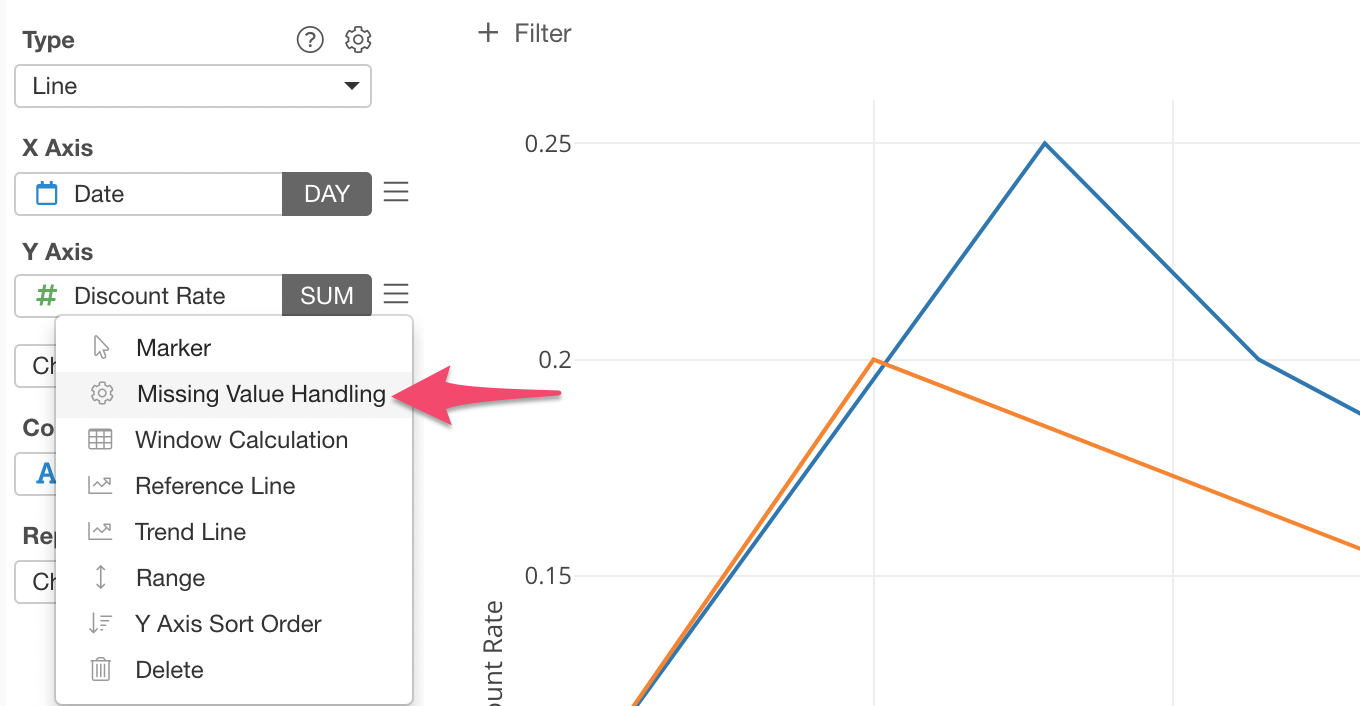
You can use ‘Missing Values Handling’ to address these type of problems.
For example, I’m selecting ‘Fill with Previous Value’ option so that the same values get repeated until there is a new value on the time horizon.