How to Fill Missing Values with Other Rows?
Here is data about the discount rates for a fictional store.
The problem is that we have the discount rate information only the dates when they change the rates. For the dates we don’t have the rate information, instead we assume that they have the same rates as the previous days.
We call these empty cells ‘Missing Values’ or NA (Not Available).
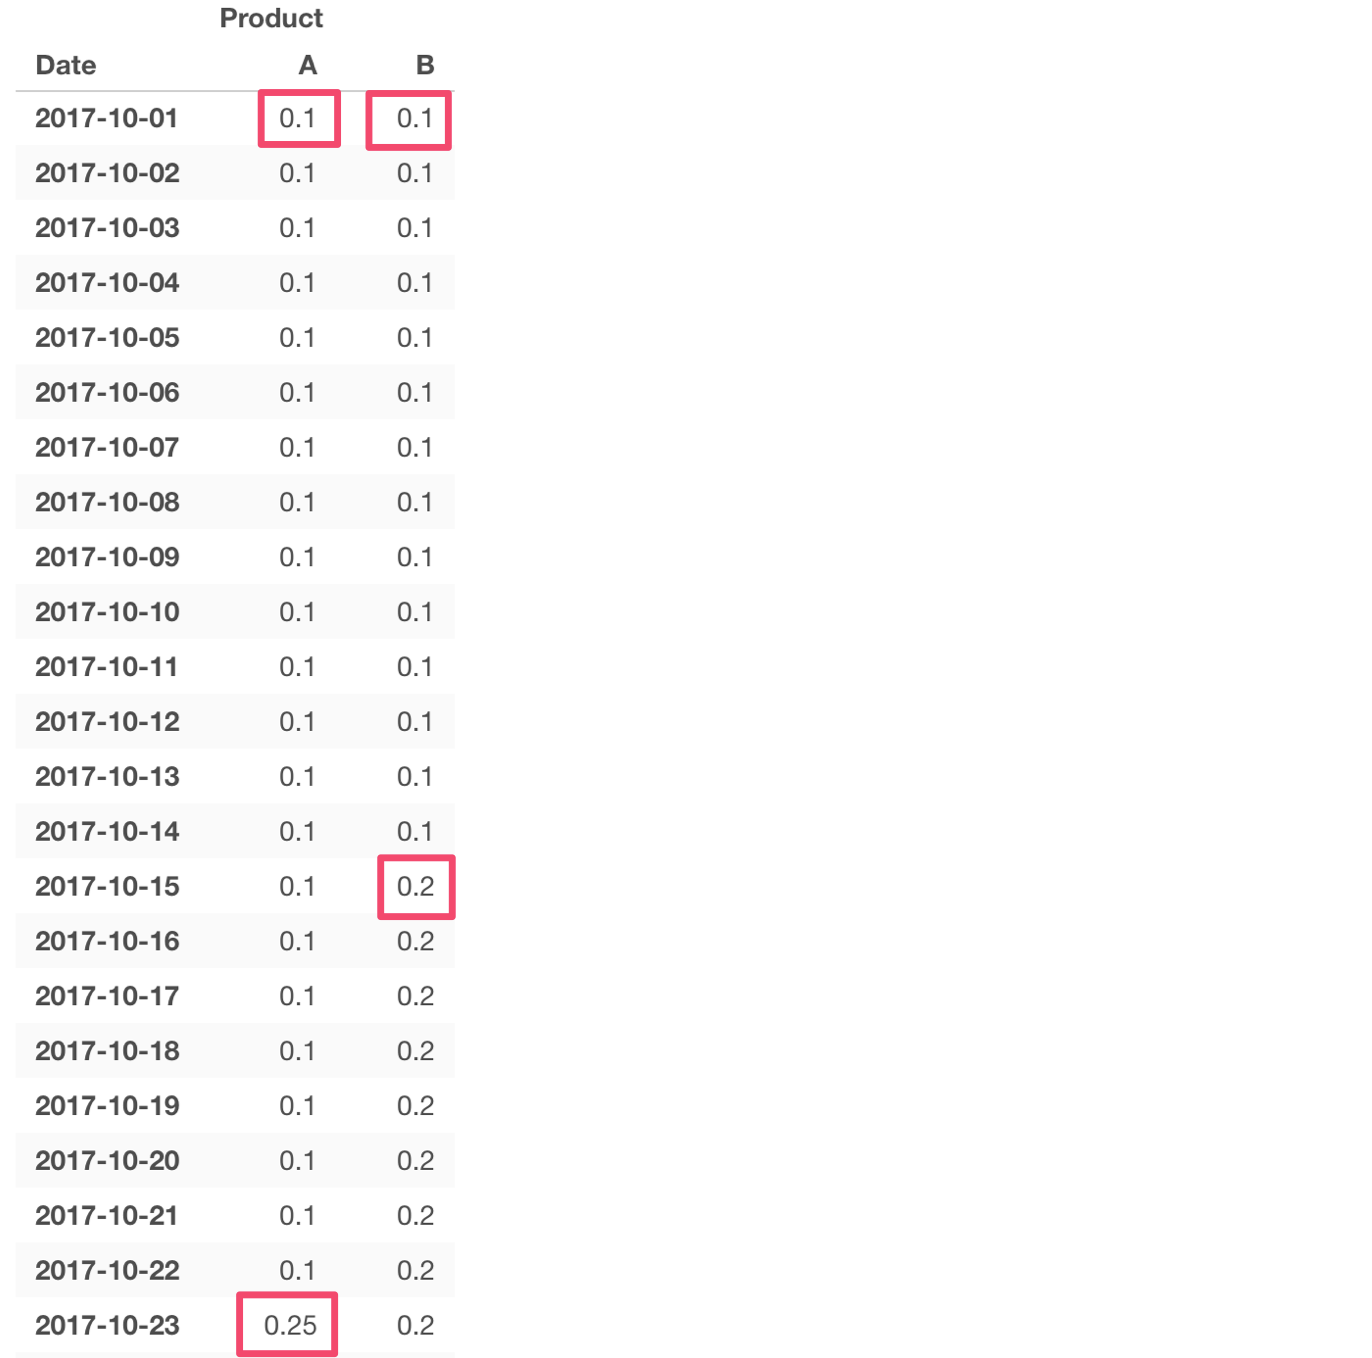
Now, let’s say we want to fill these NAs with the previous available values so that we’ll have data like the below.
To do, you can use the Fill step in Exploratory.
Here is how.
Run ‘Fill’ Step
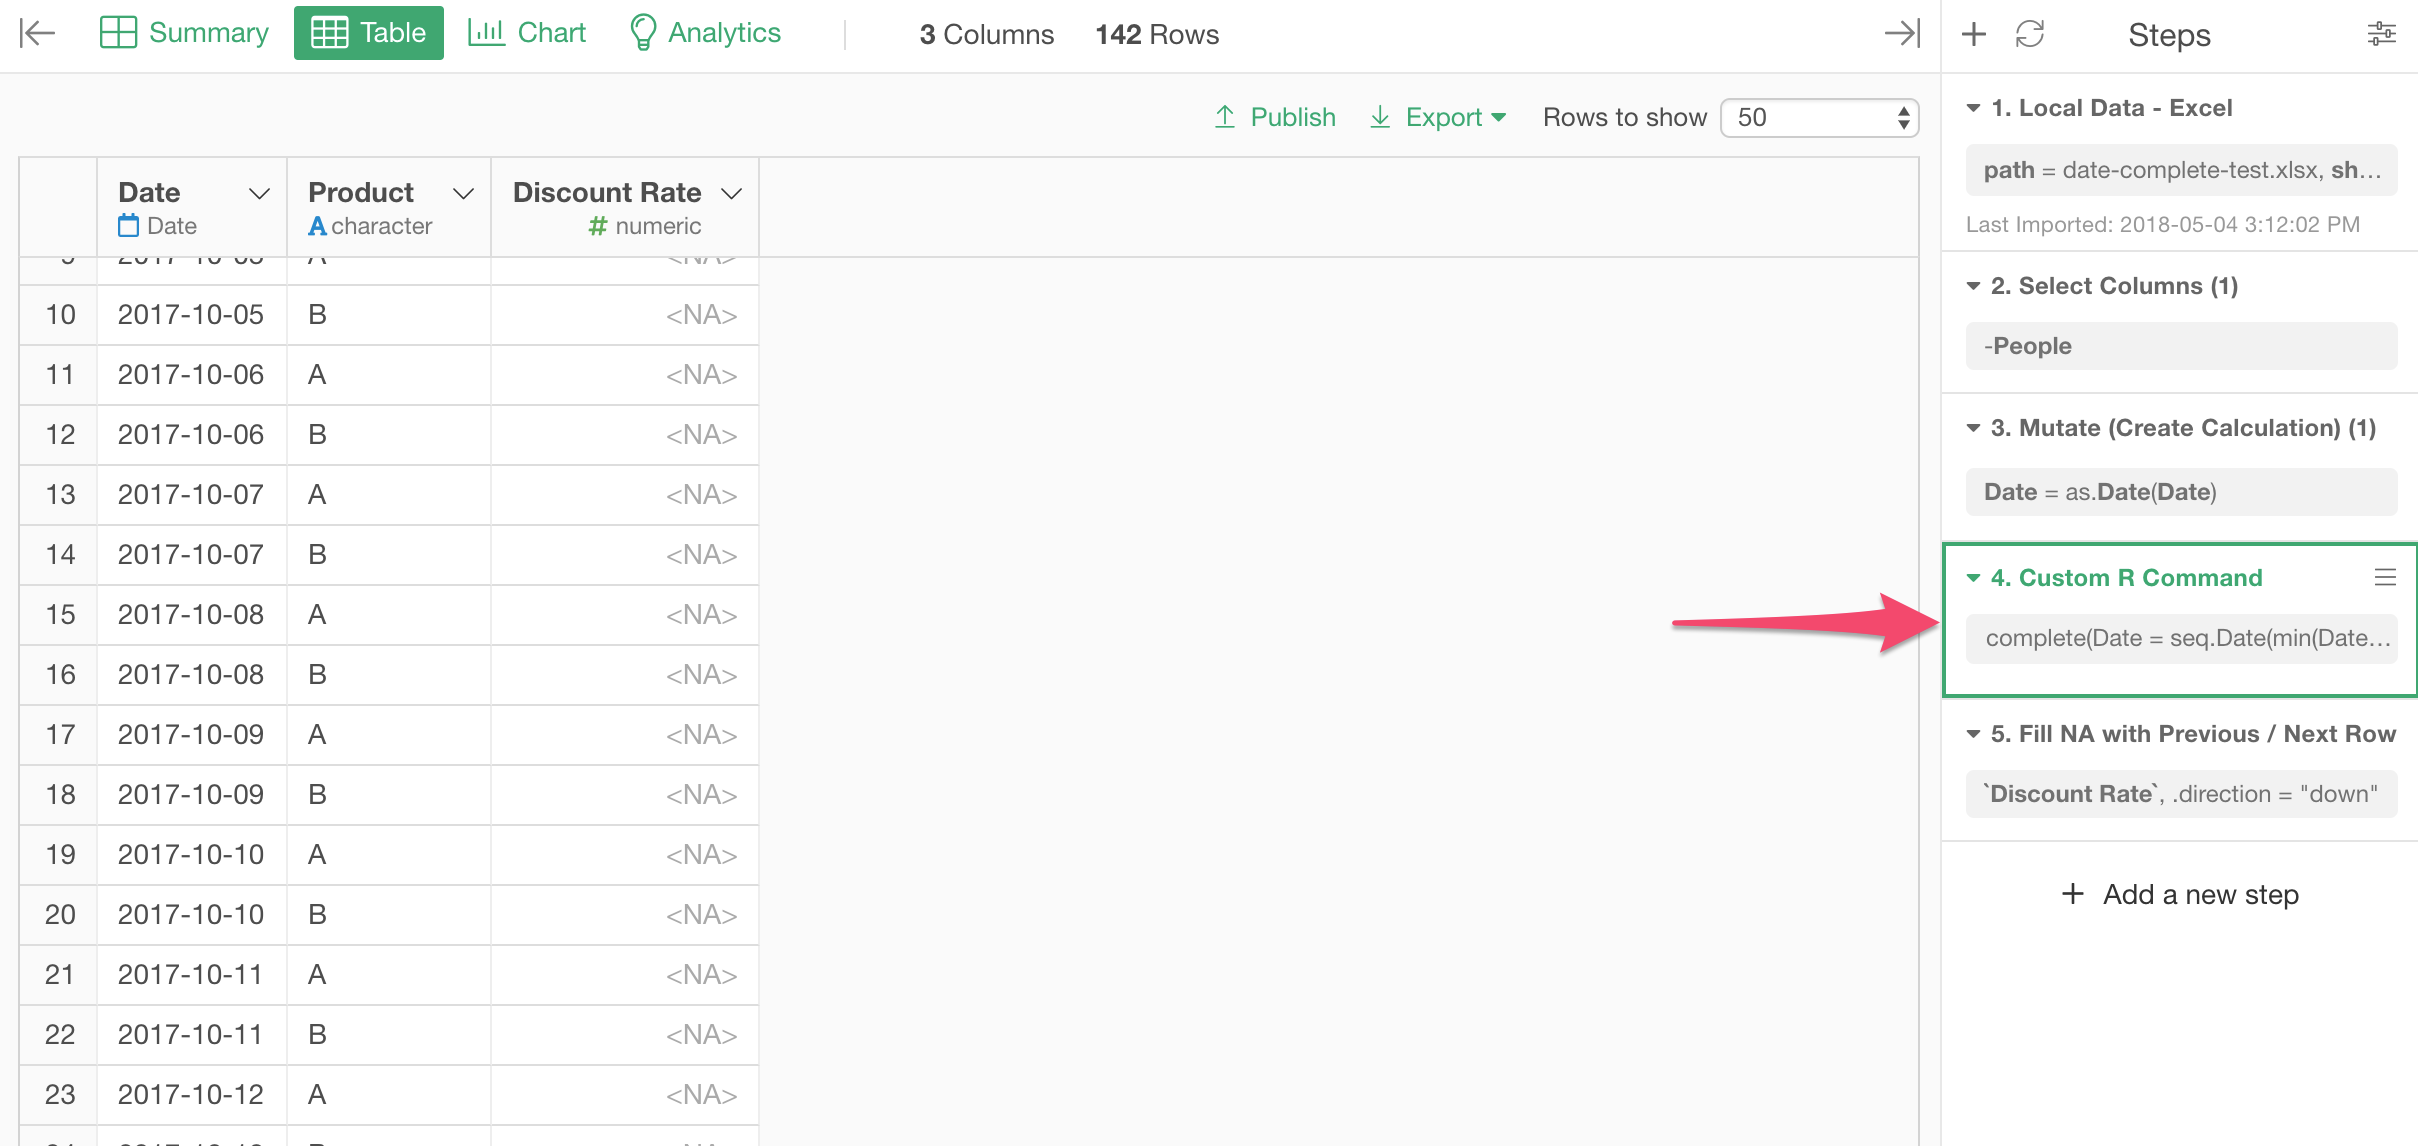
First, you want to be under Table view.
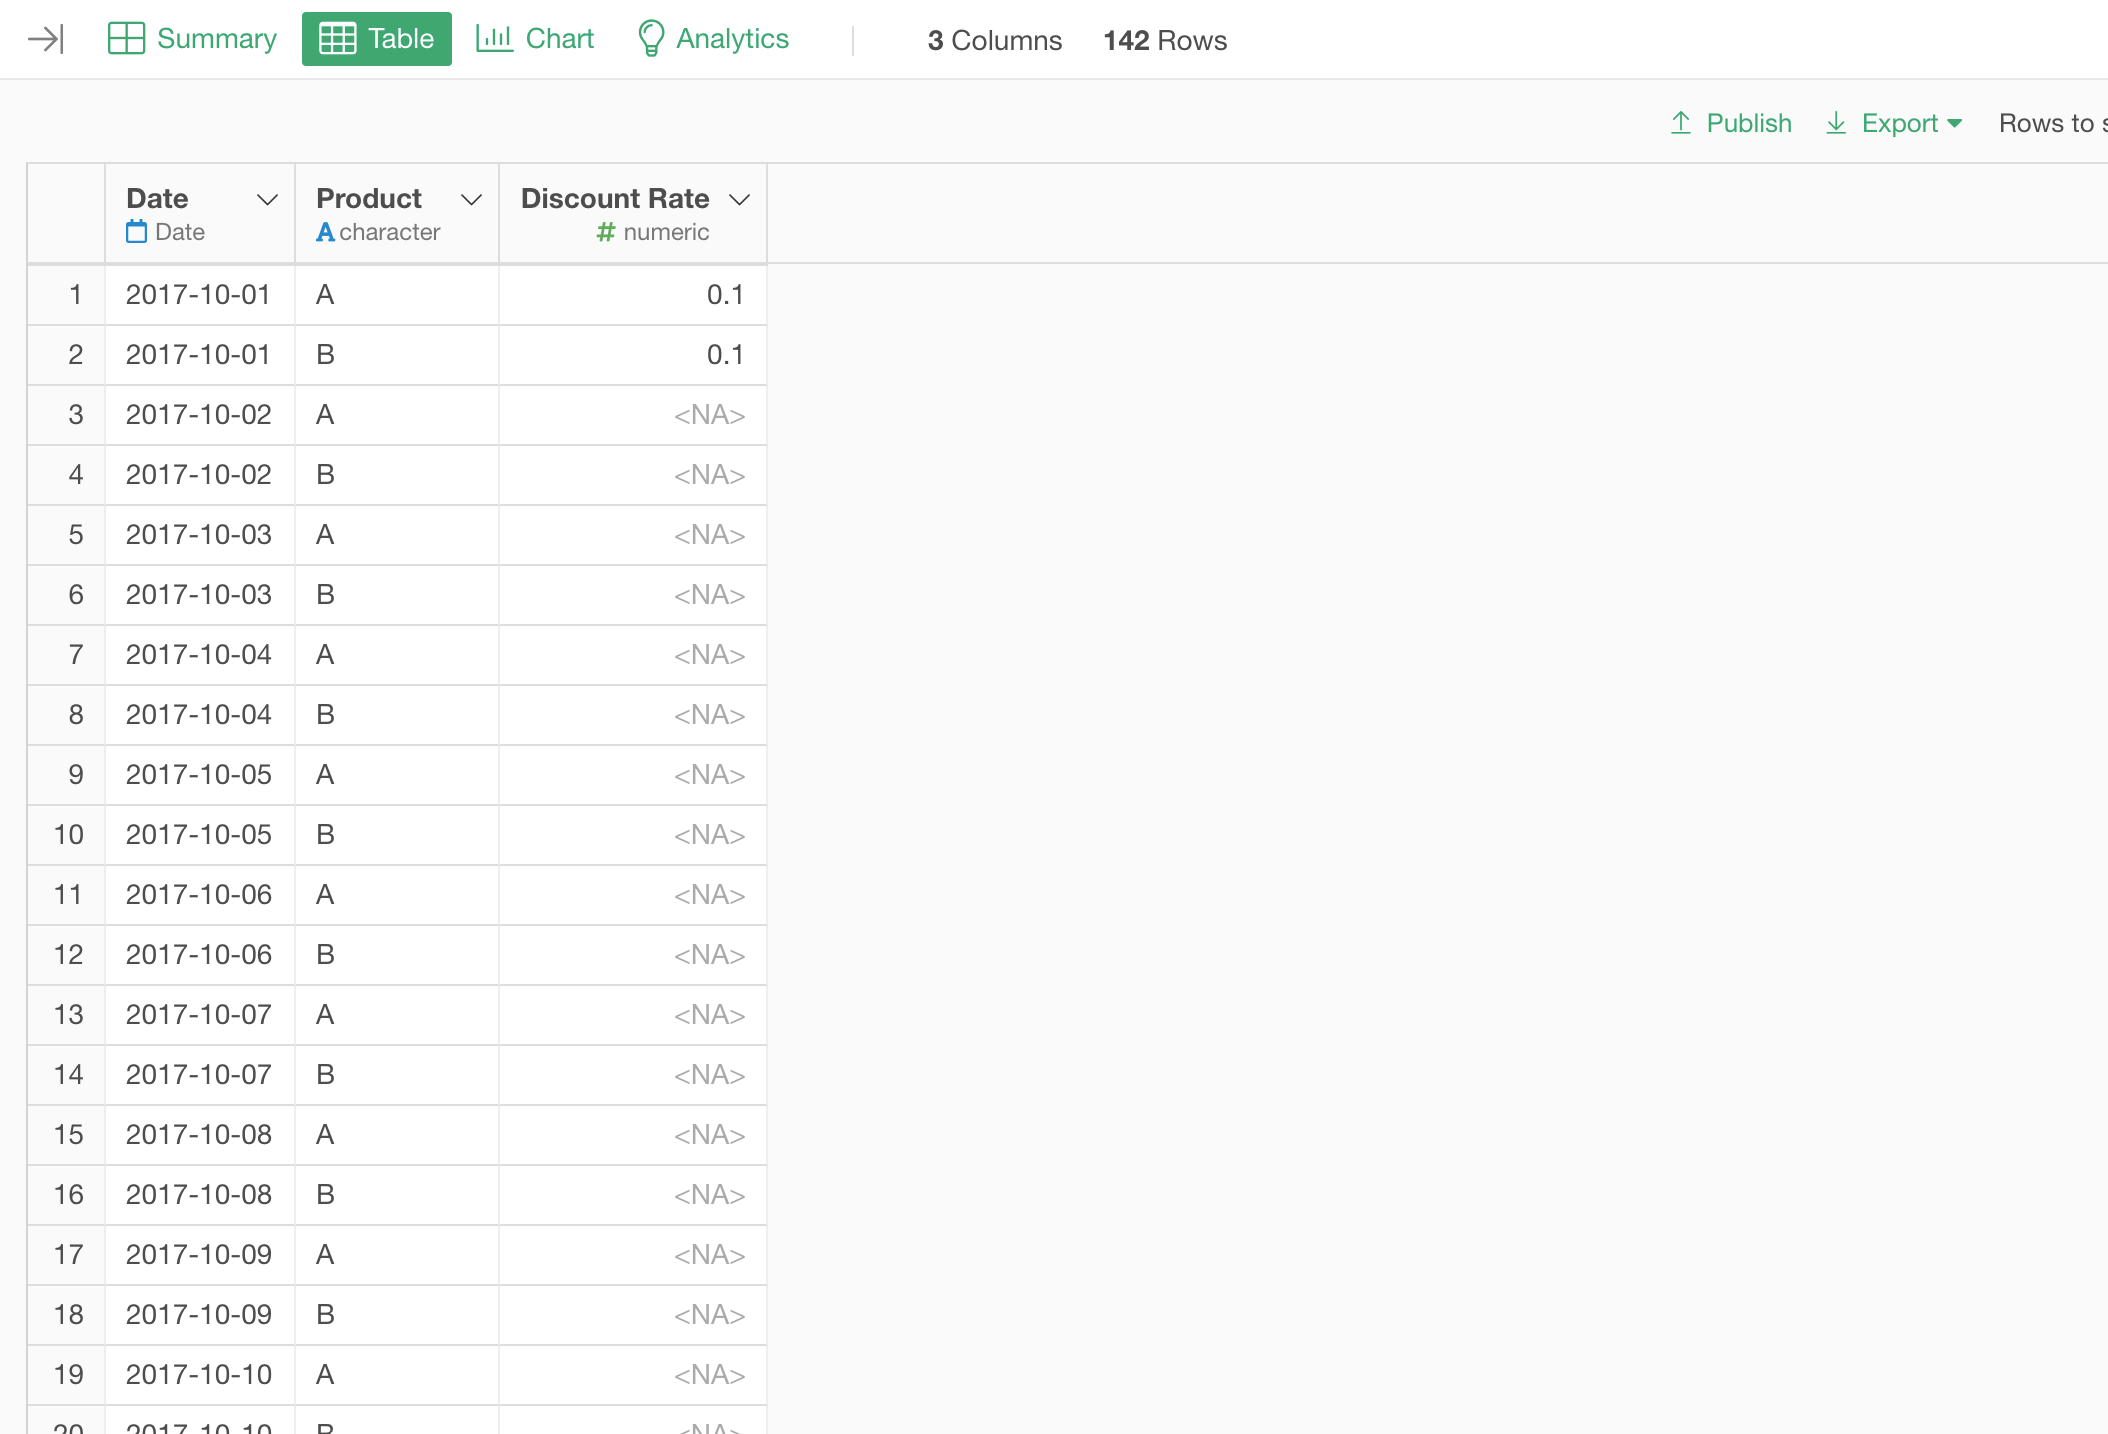
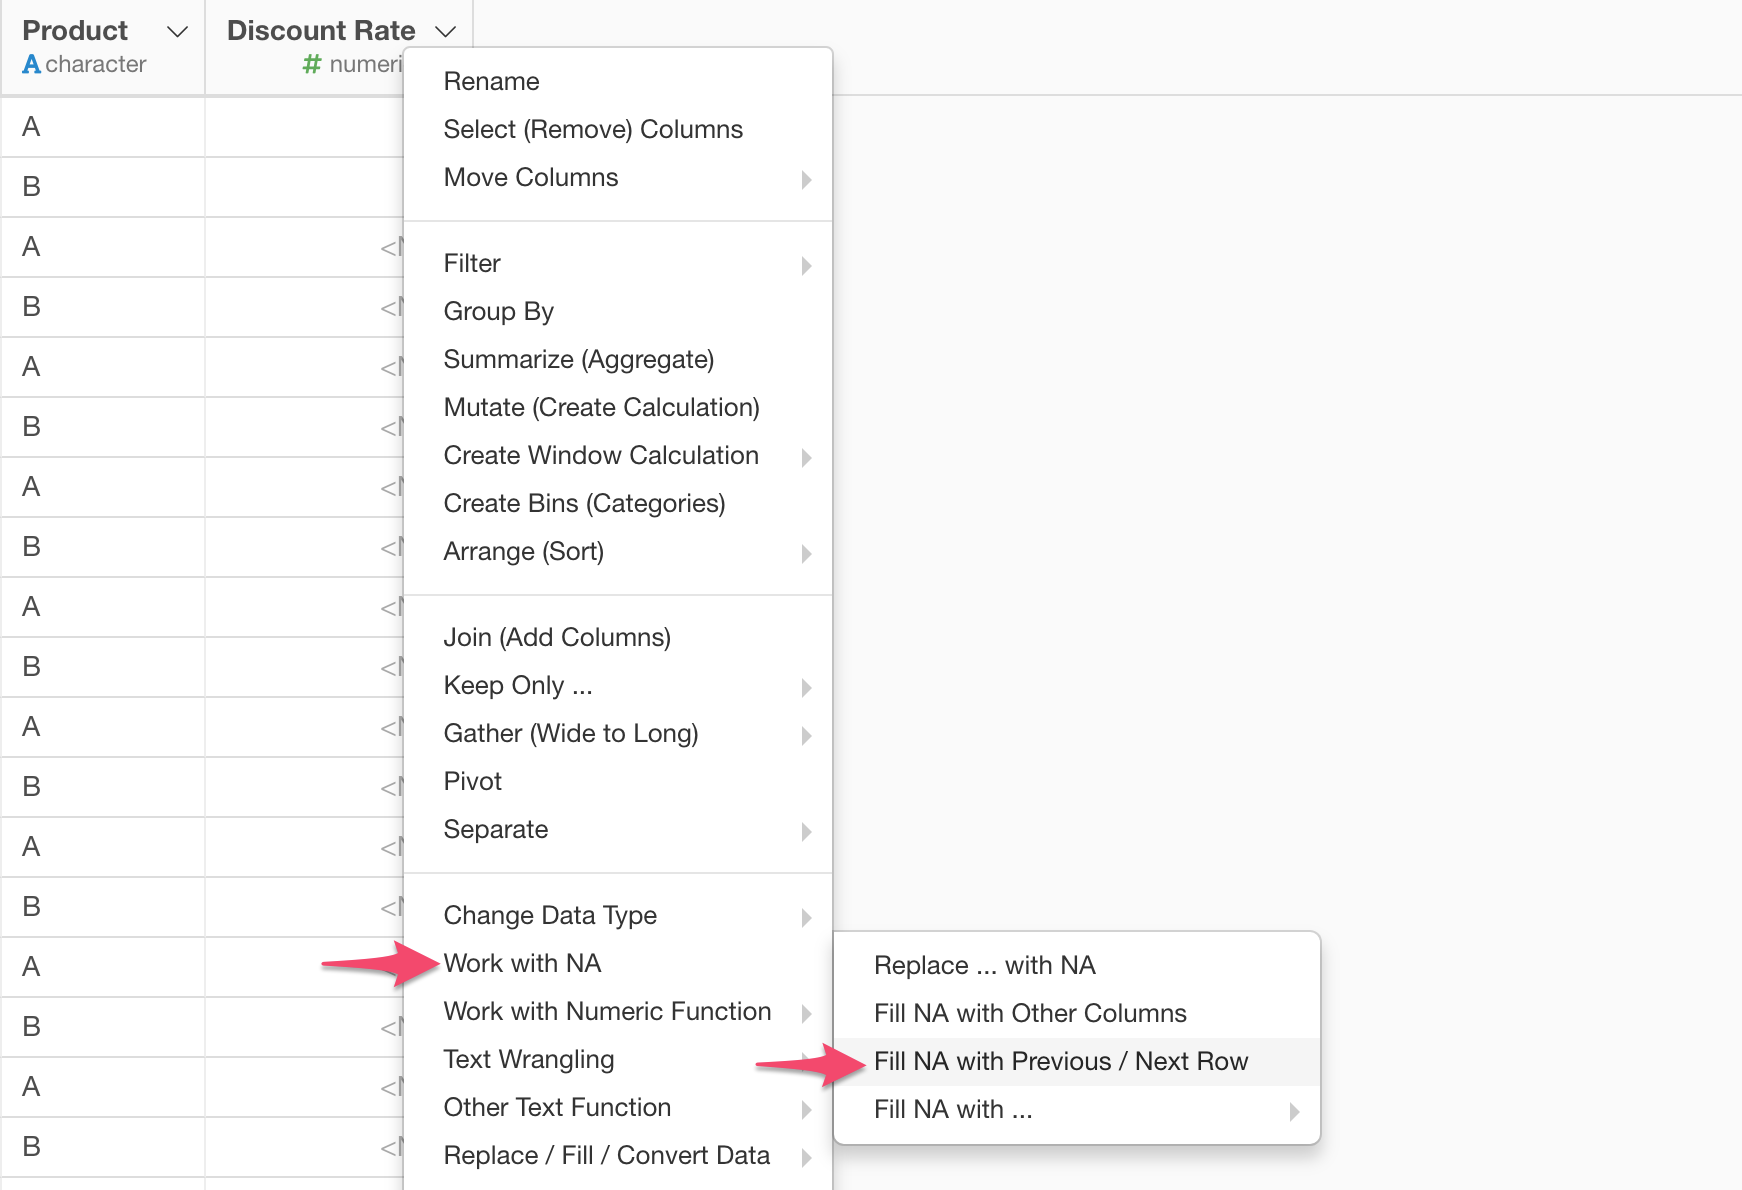
Note that we have a Product column with values as either A or B and Discount Rate column which has the corresponding discount rates.
In order to fill the NAs with the previous, you want to select ‘Work with NA’, then ‘Fill NA with Preivous / Next Row’.
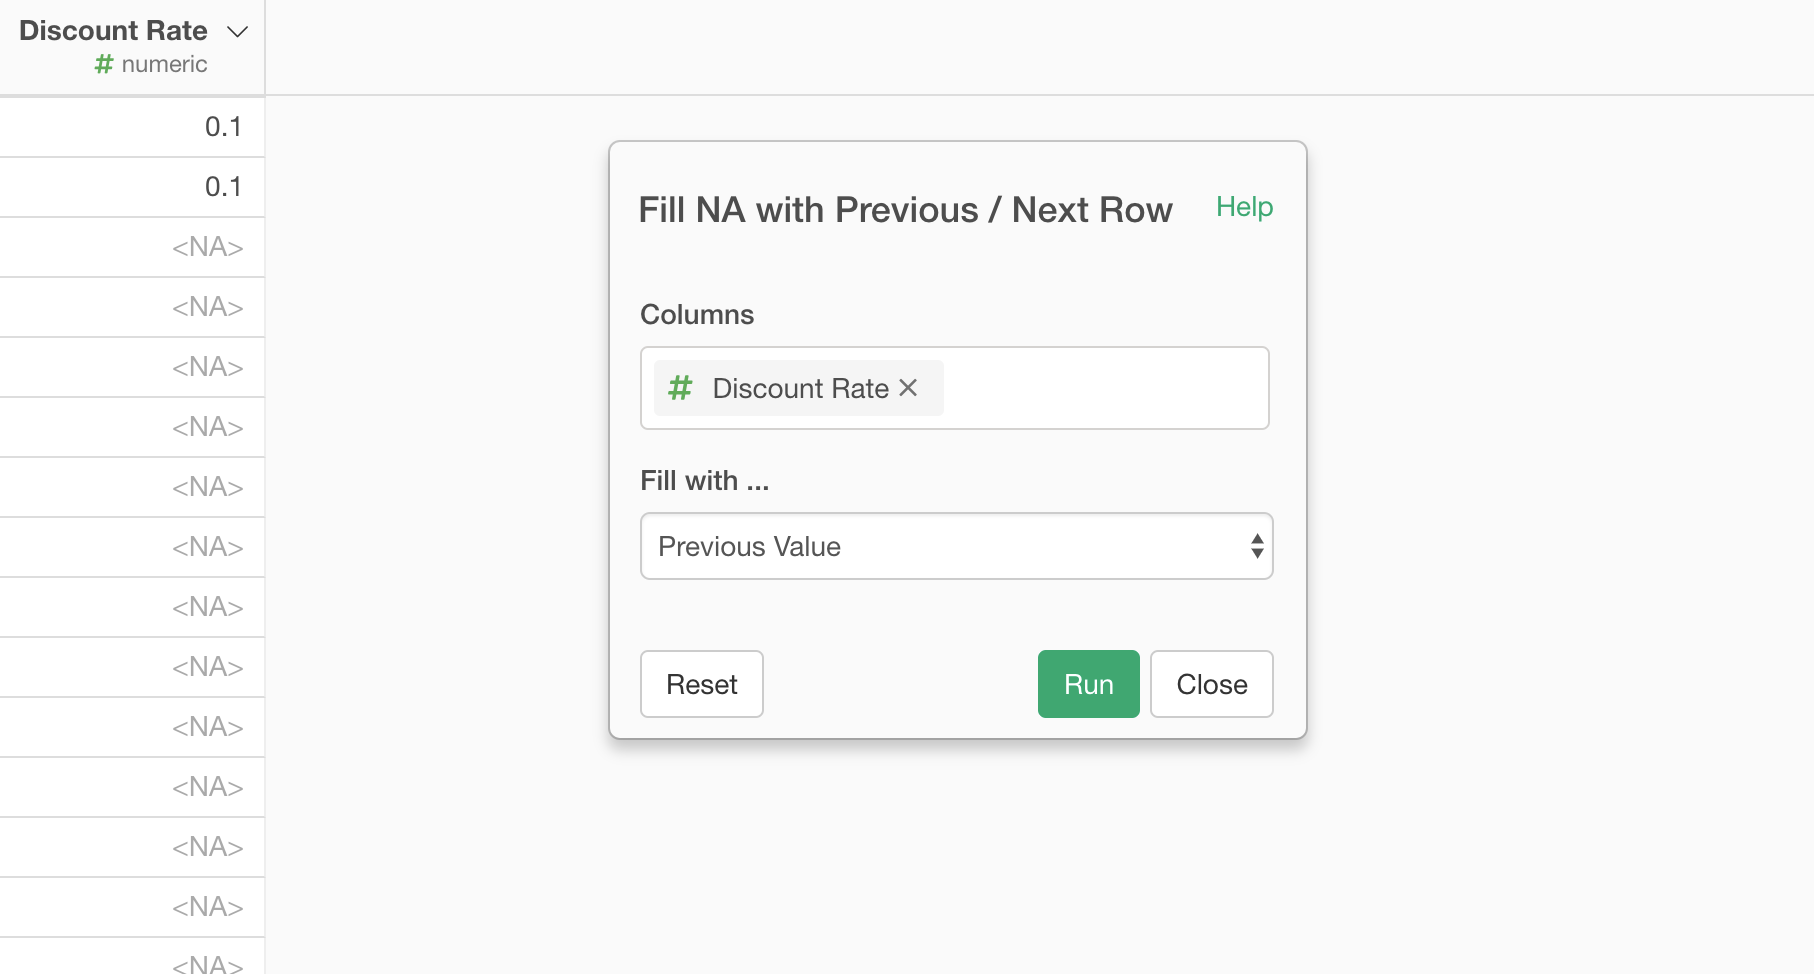
Simply, click ‘Run’ button.
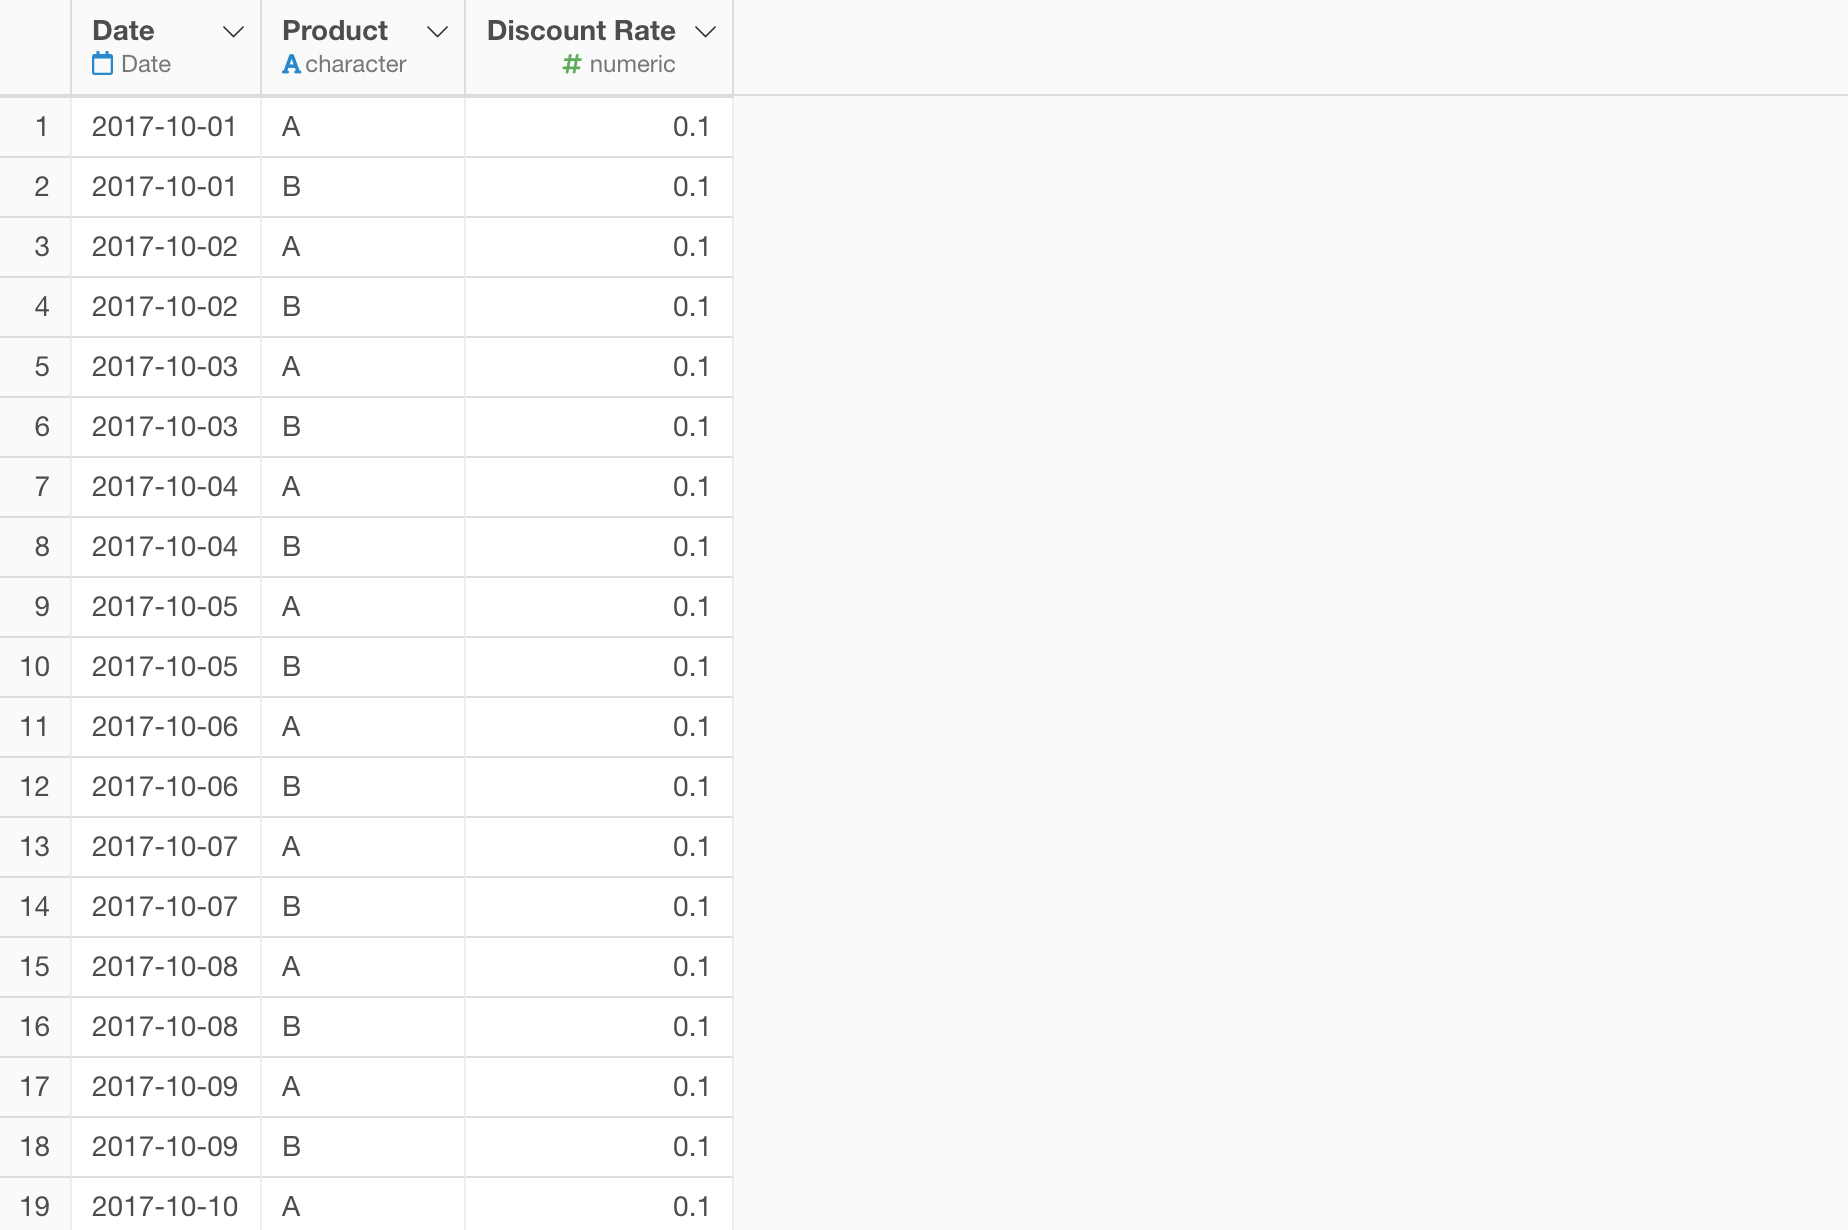
The NAs are now filled with the previously available values.
But here is a problem.
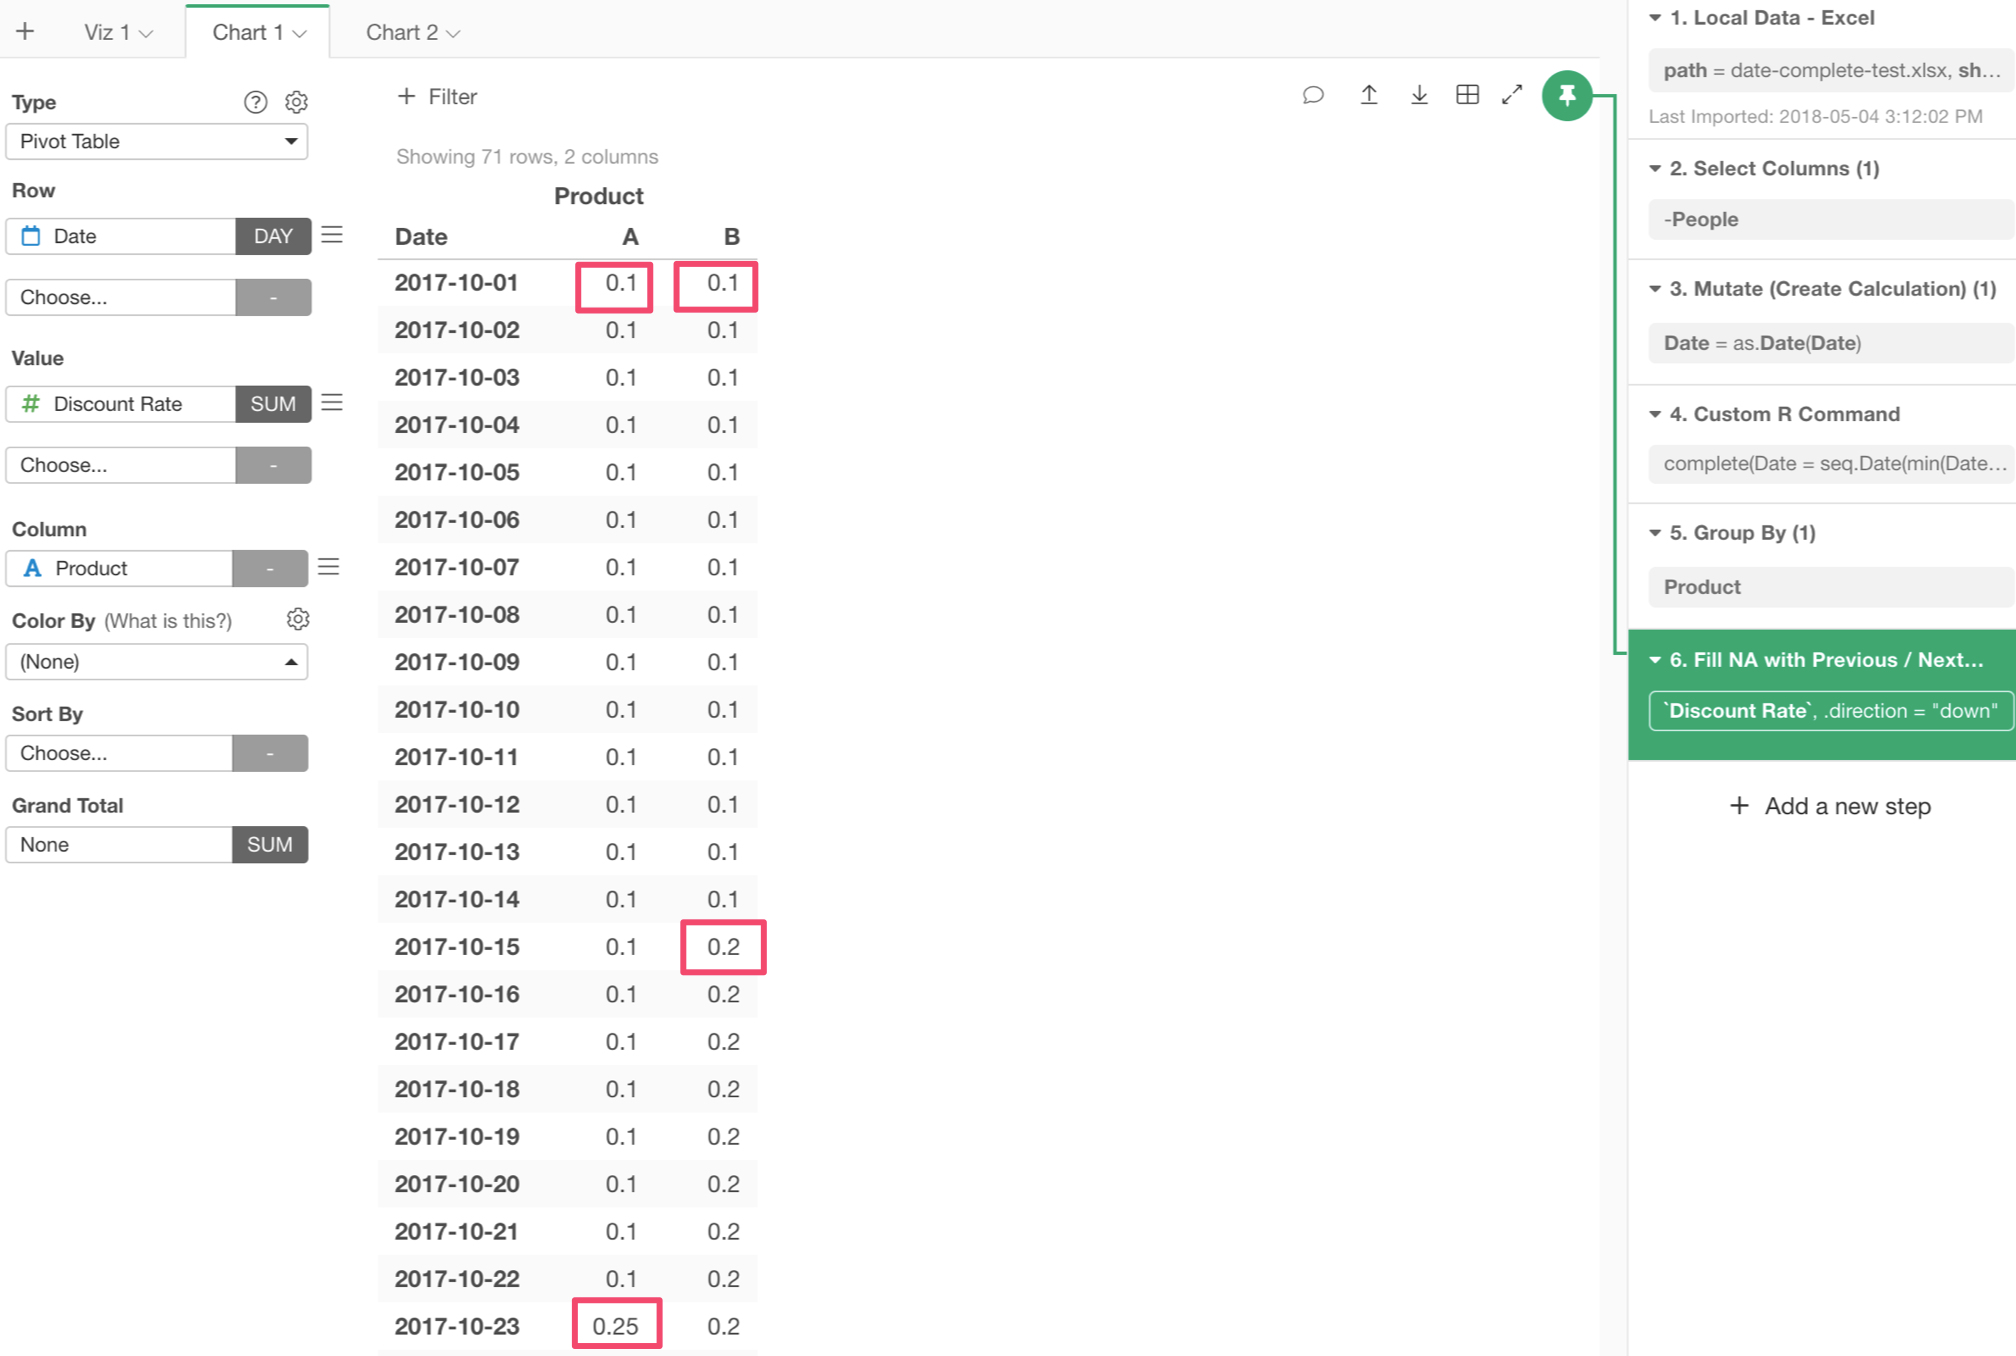
Let’s create a pivot table by assigning the ‘Date’ column to Row, the ‘Product’ column to Column, and the ‘Discount Rate’ column to Value.
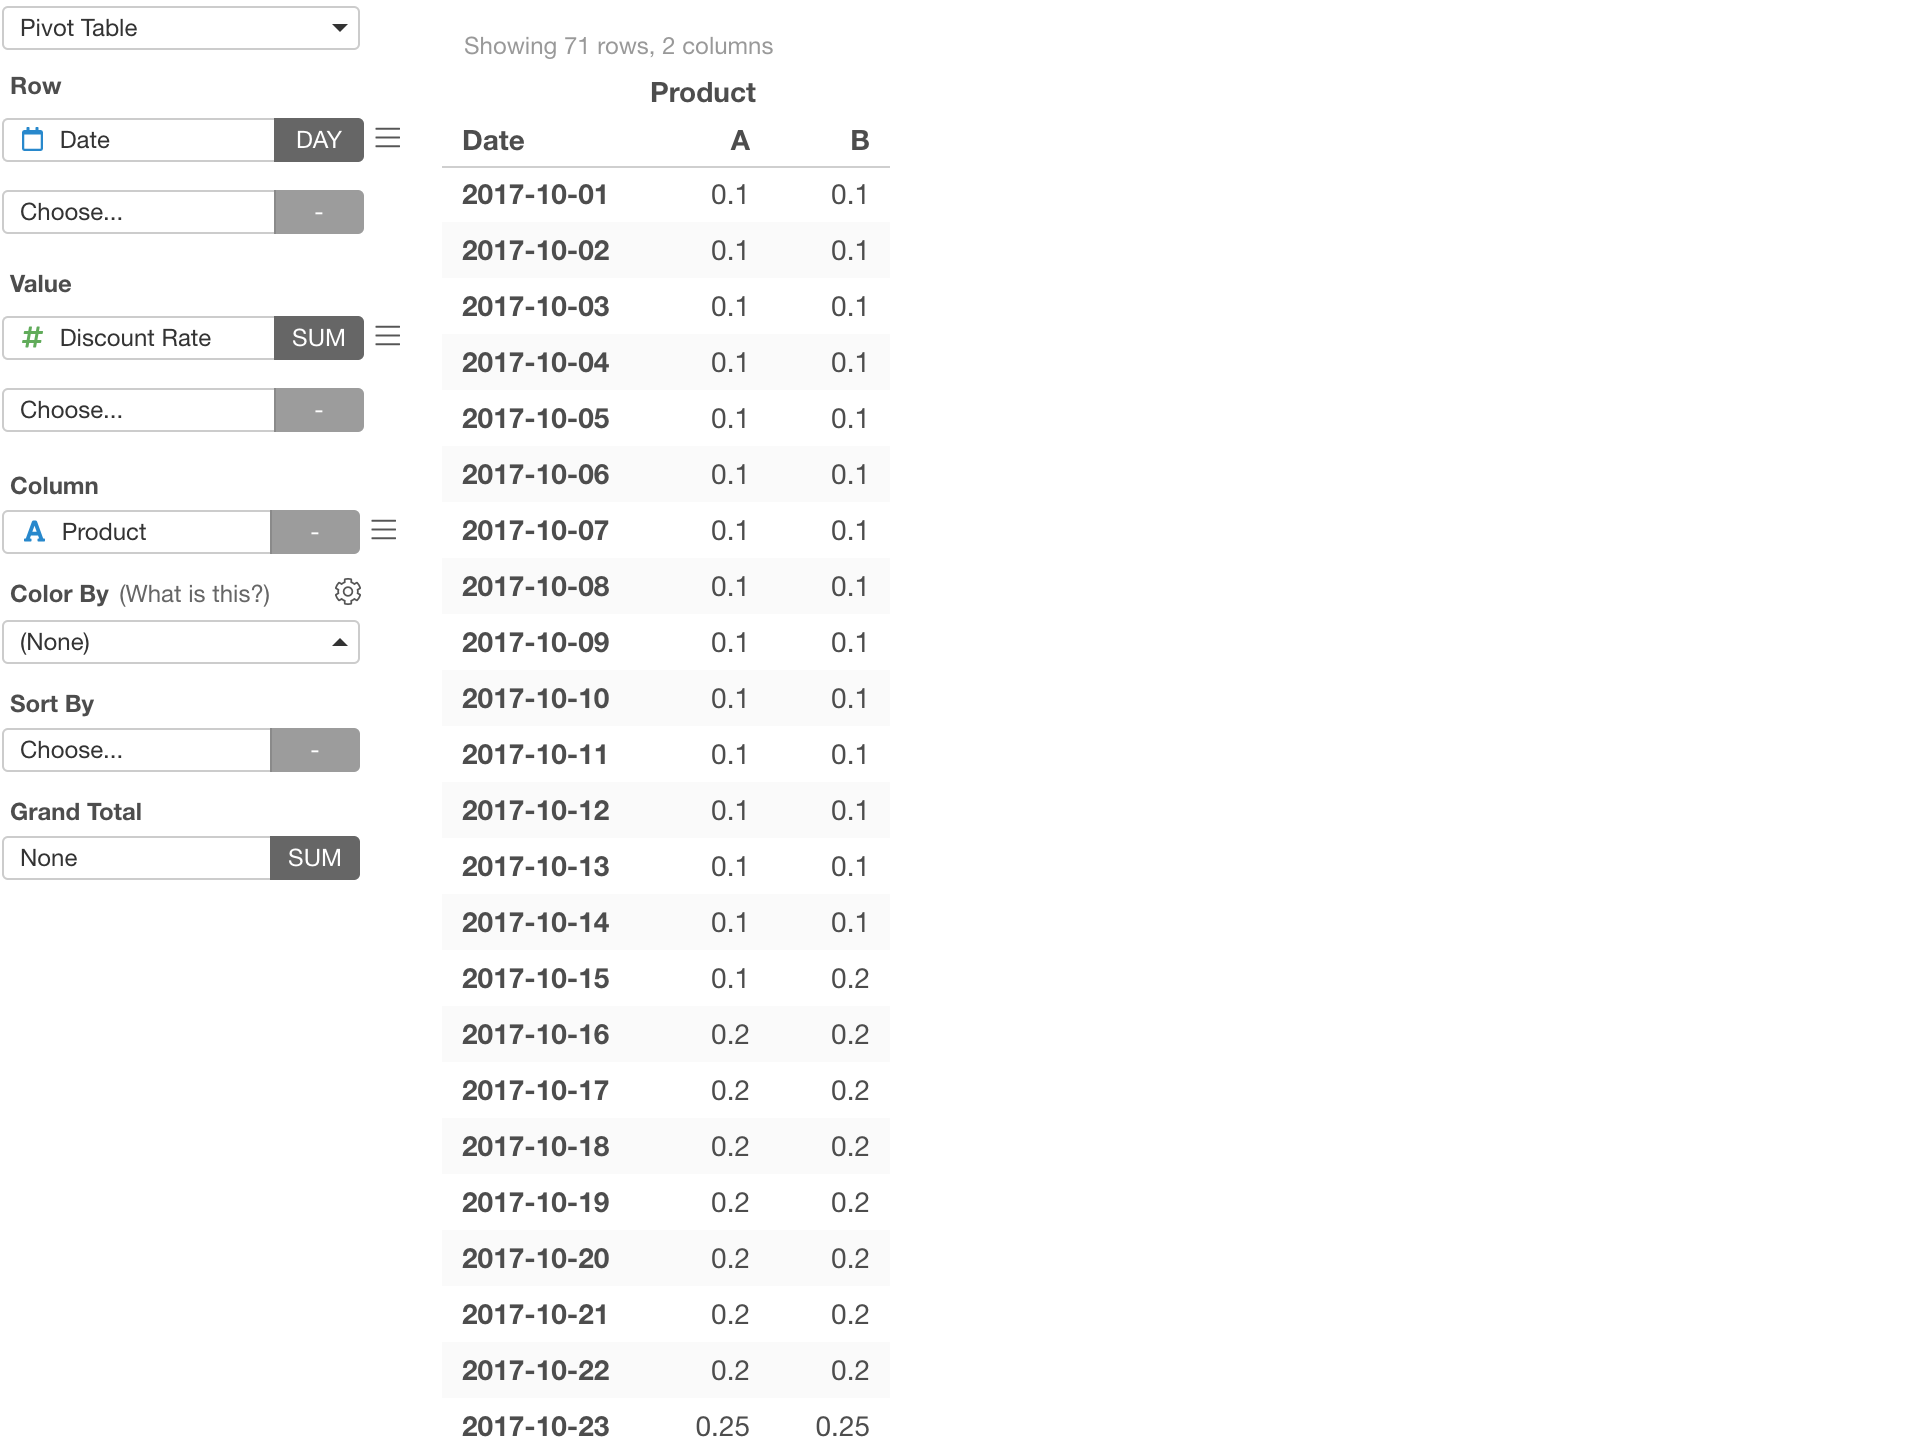
Take a look at the red bordered cells.
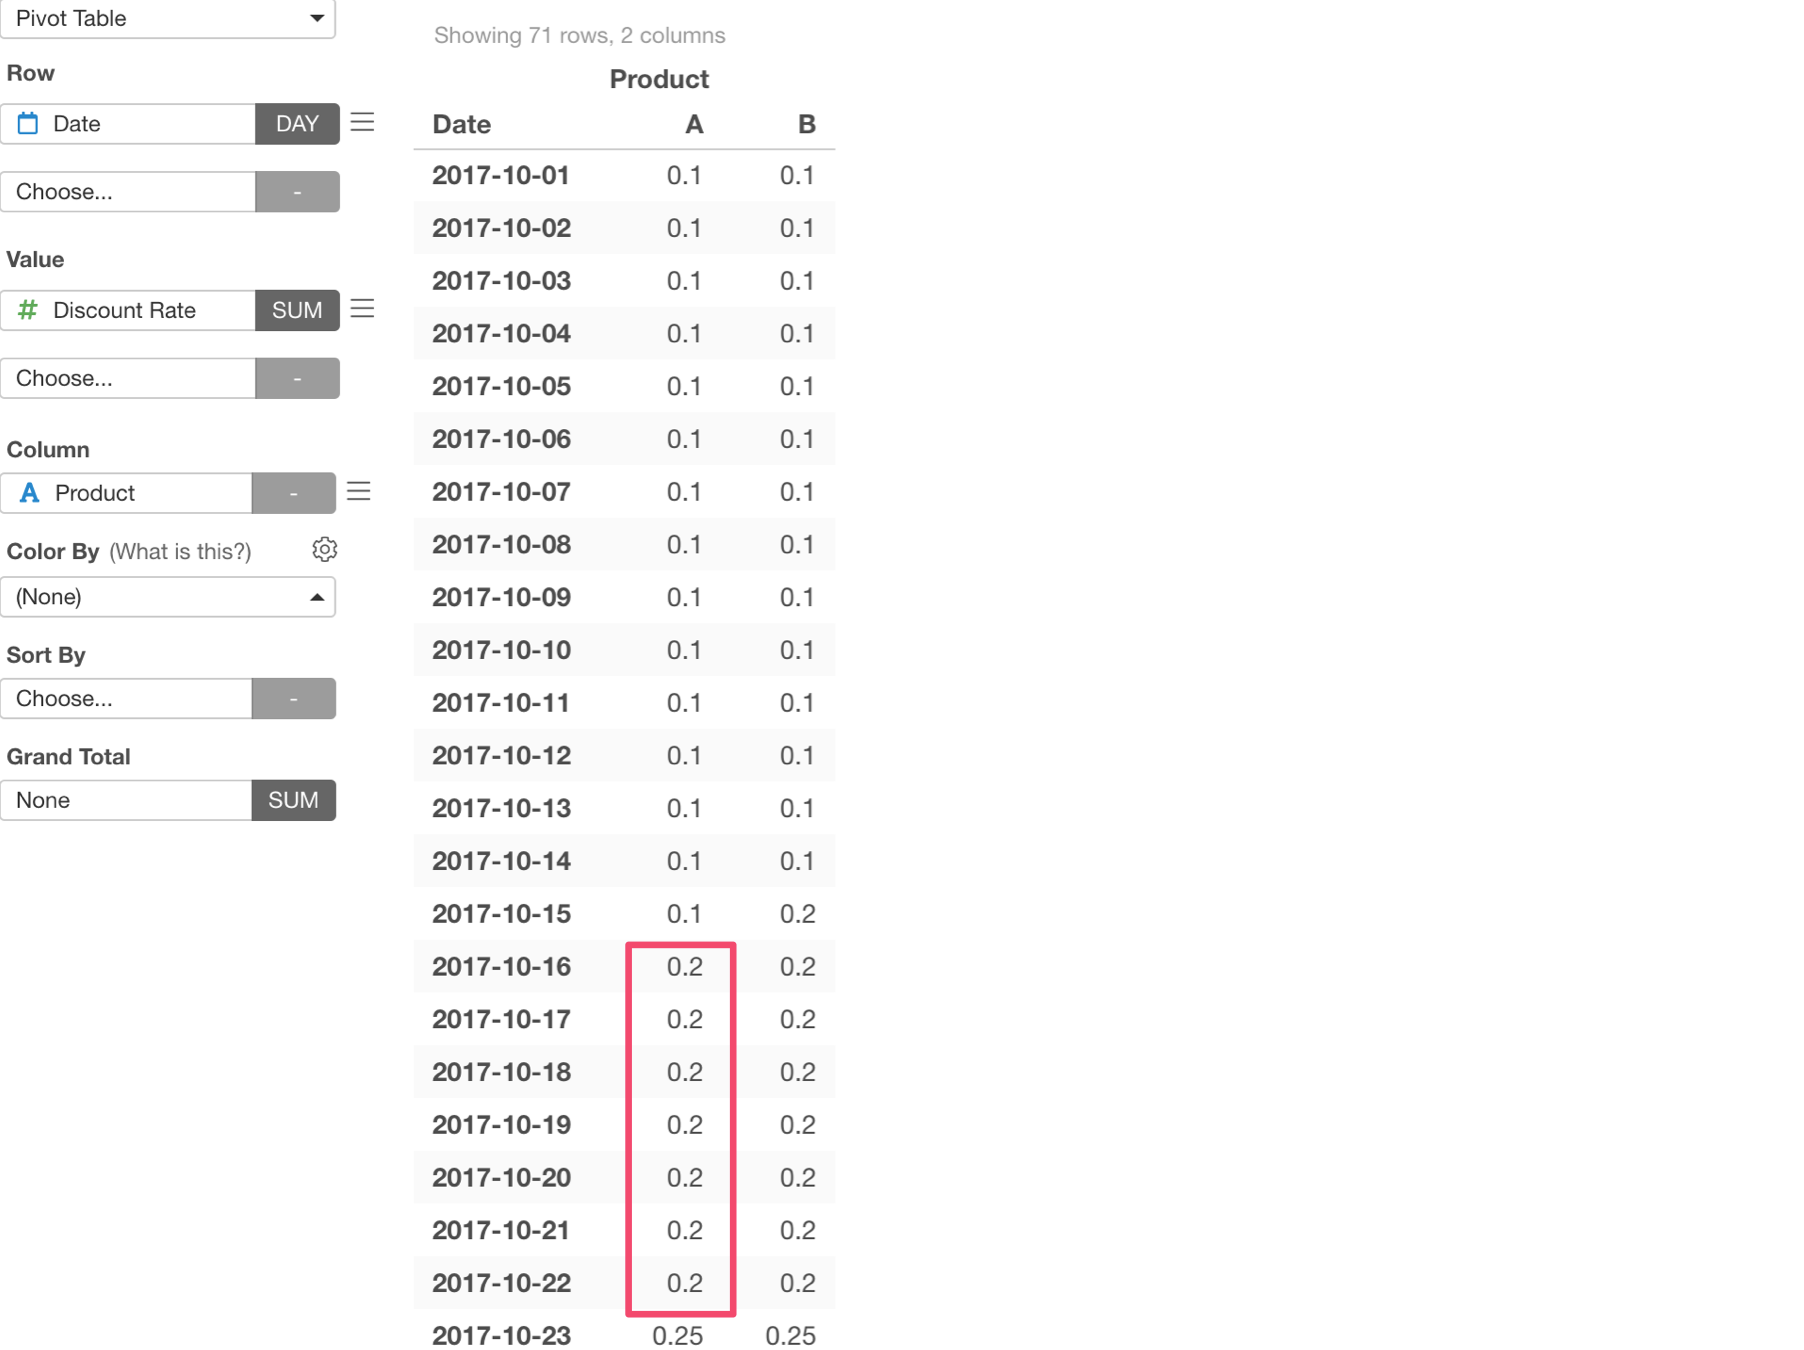
These dates for the product A should not have been 0.2, it should have been 0.1.
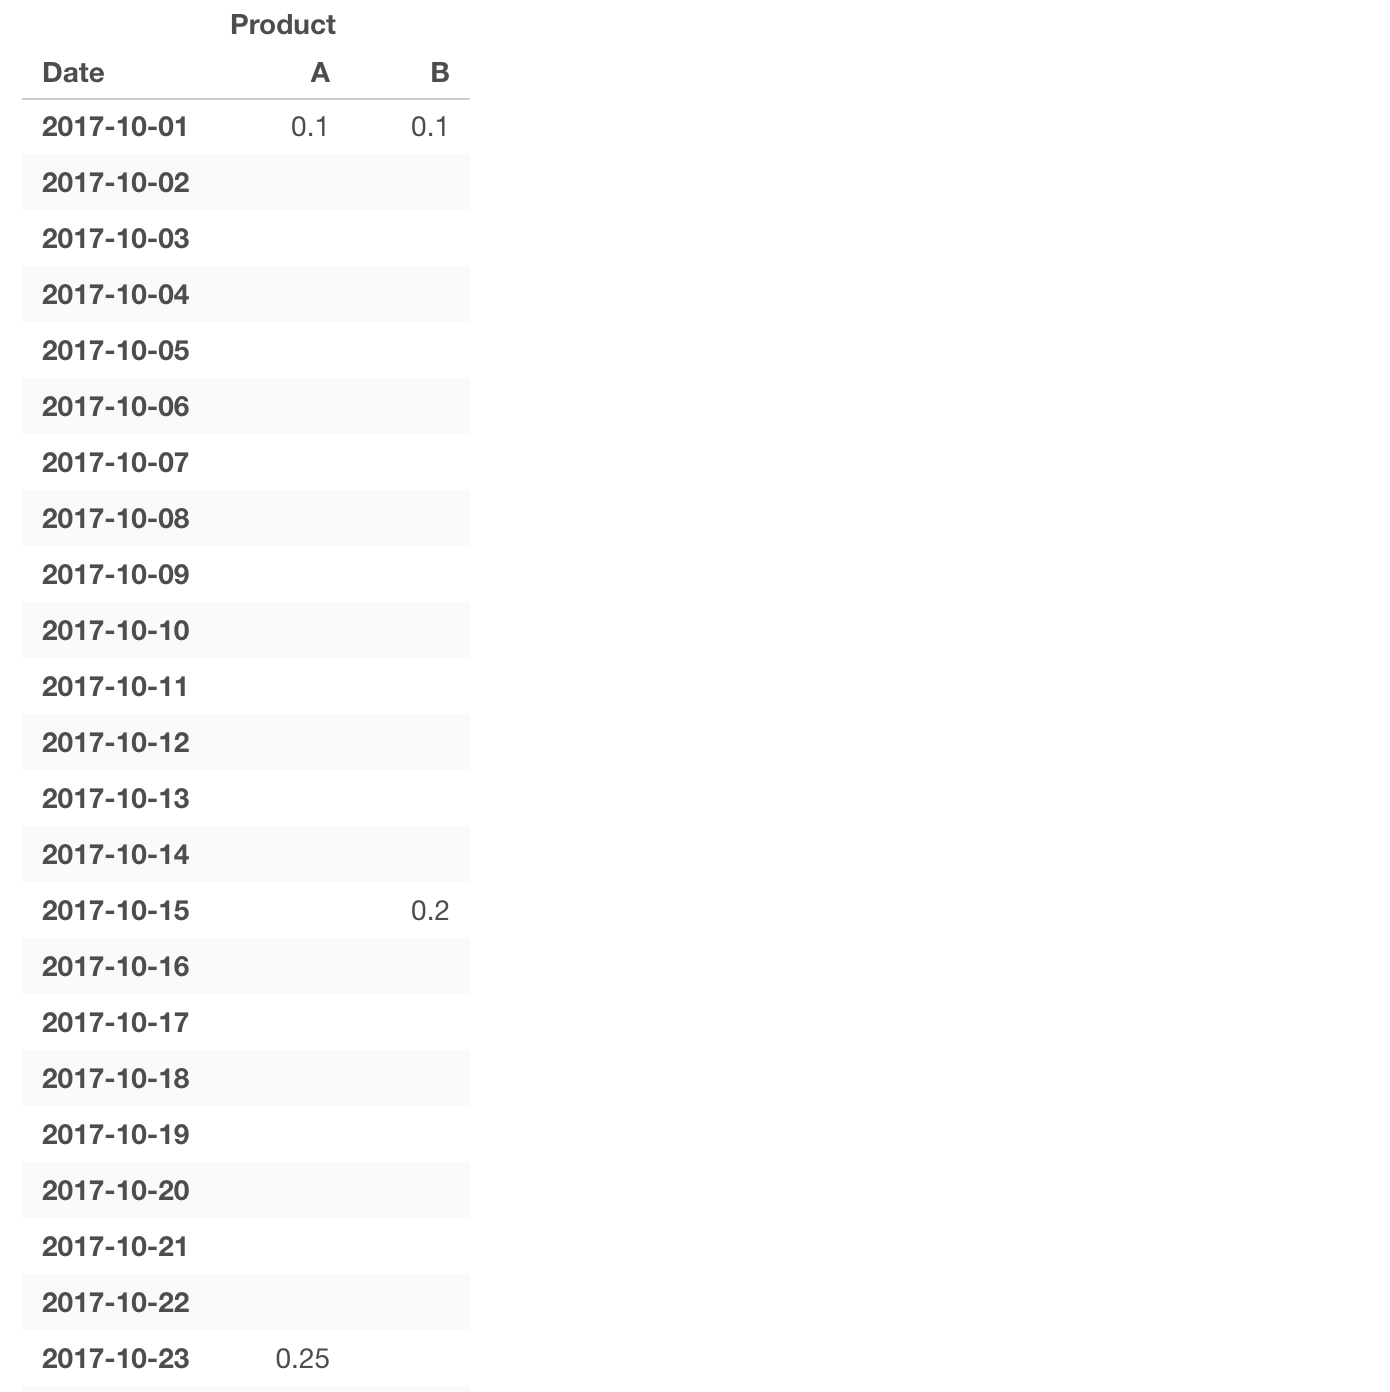
Here’s the data shown in the Pivot table before the ‘Fill’ step.
And here is the desired output.
So, we want to fill the NAs with the previously available values, but we want it to happen in each product group (A or B).
The good news is, we can do this pretty quickly by adding Group By step before the Fill step.
Run ‘Fill’ Step after ‘Group By’ Step
Group By step makes the data to be grouped (or partitioned if you will). This means that all the operations against the ‘grouped’ data frame will be executed against each group separately.
And that means, if we run the Fill step after the Group By step, then the NA filling operation will happen in each group of the product A and B. Perfect!
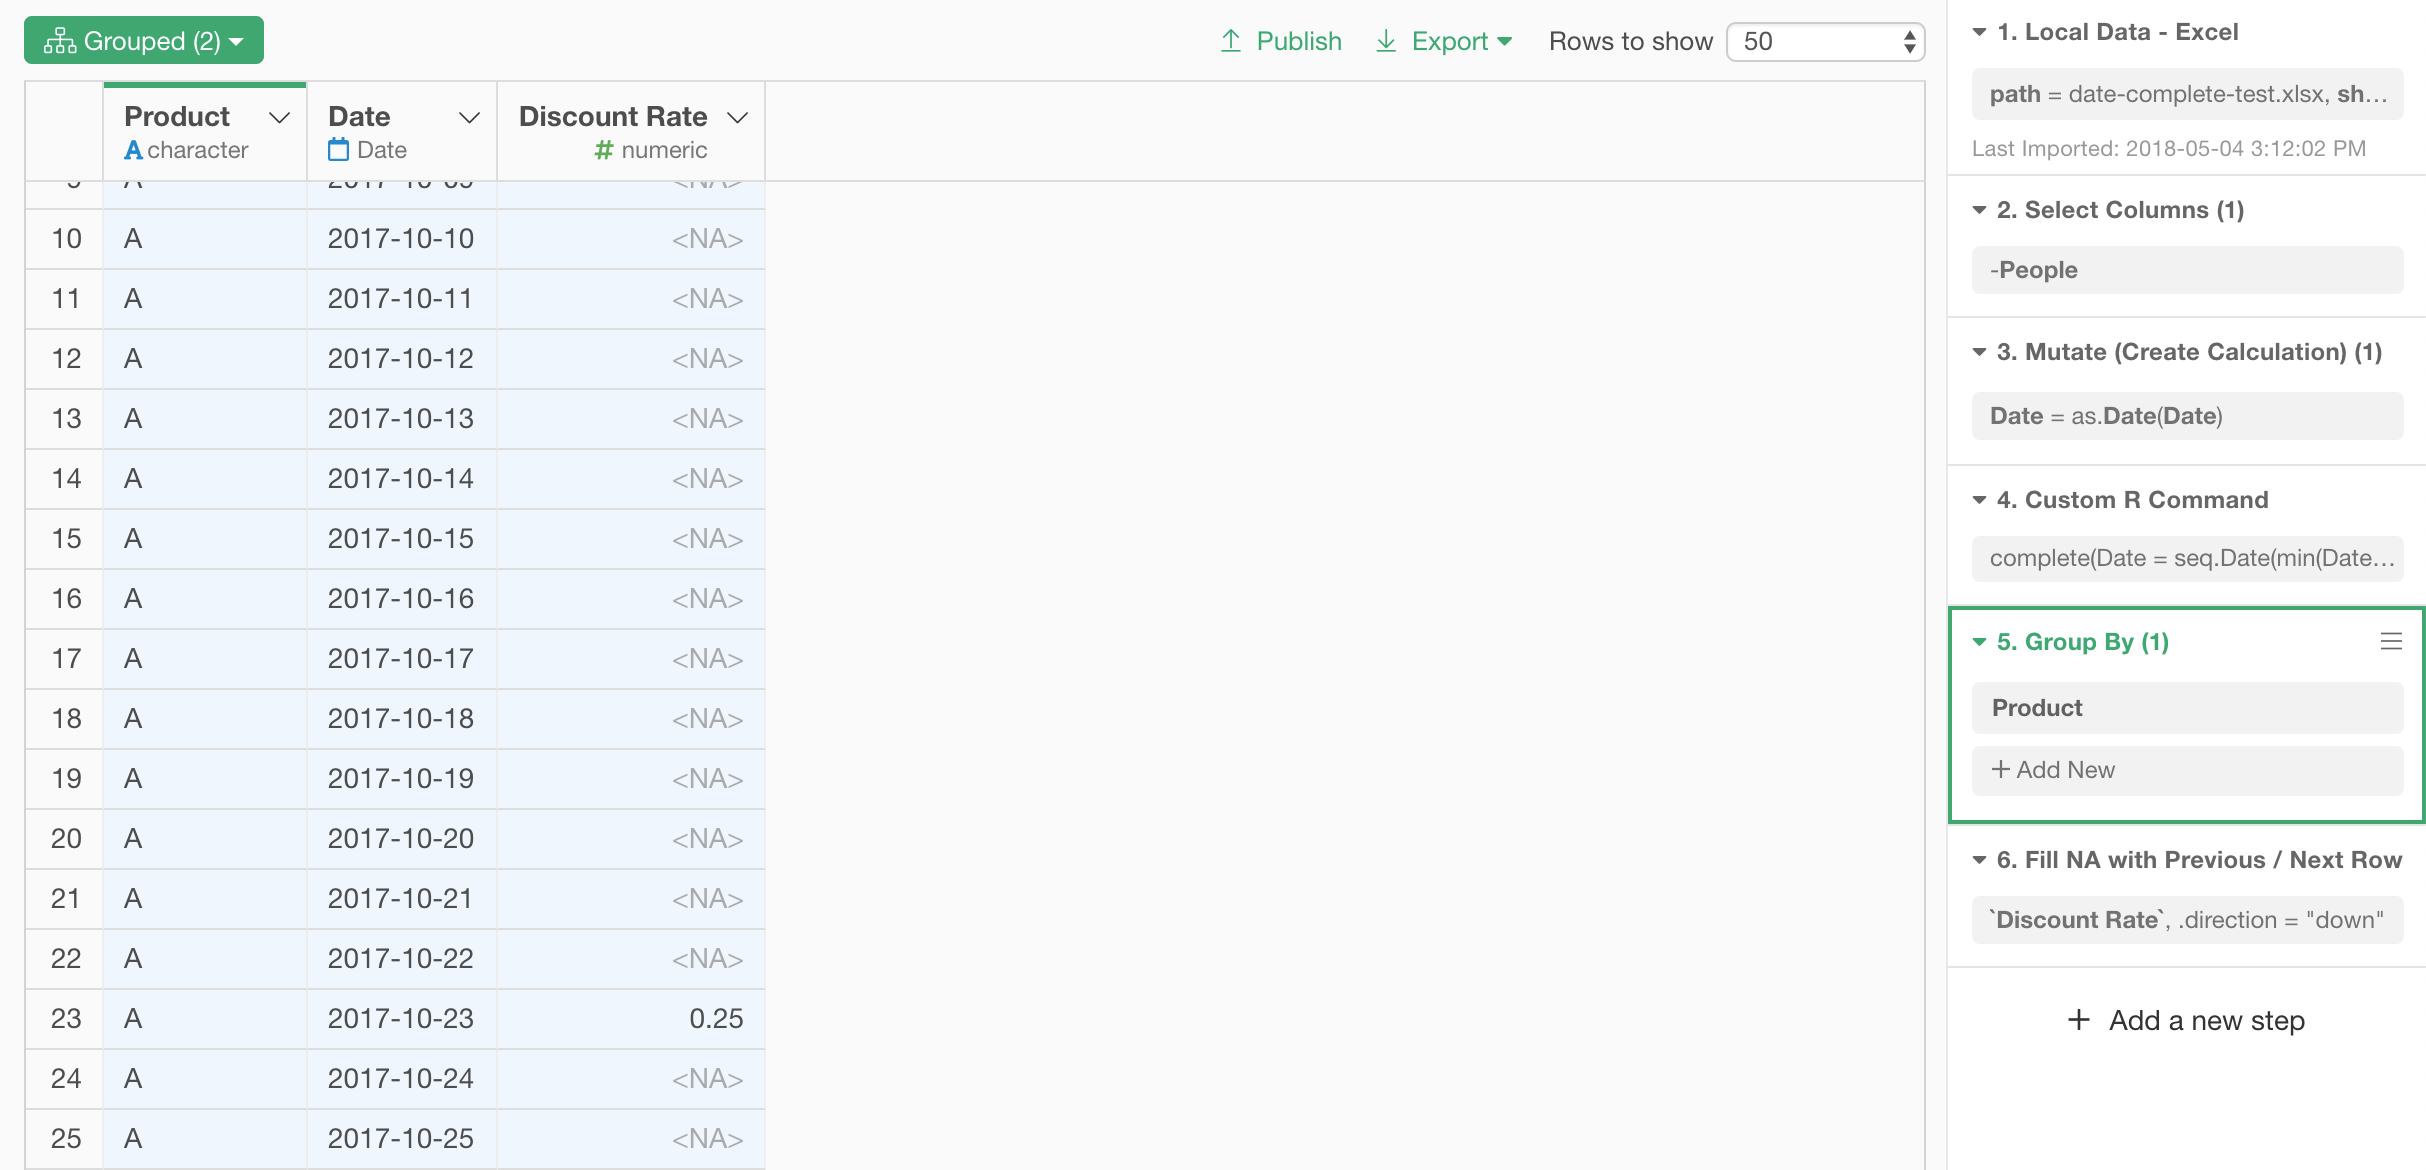
Make sure to select the step before the Fill step first.
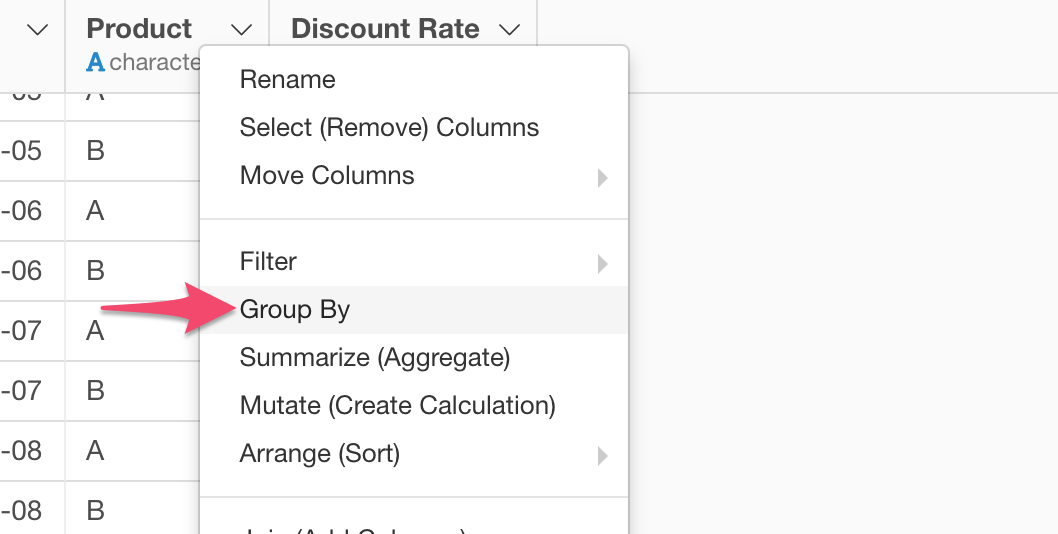
Then, select ‘Group by’ from the column header menu of the Product column.
Each color on the table indicates each group.
Now, select the Fill step.
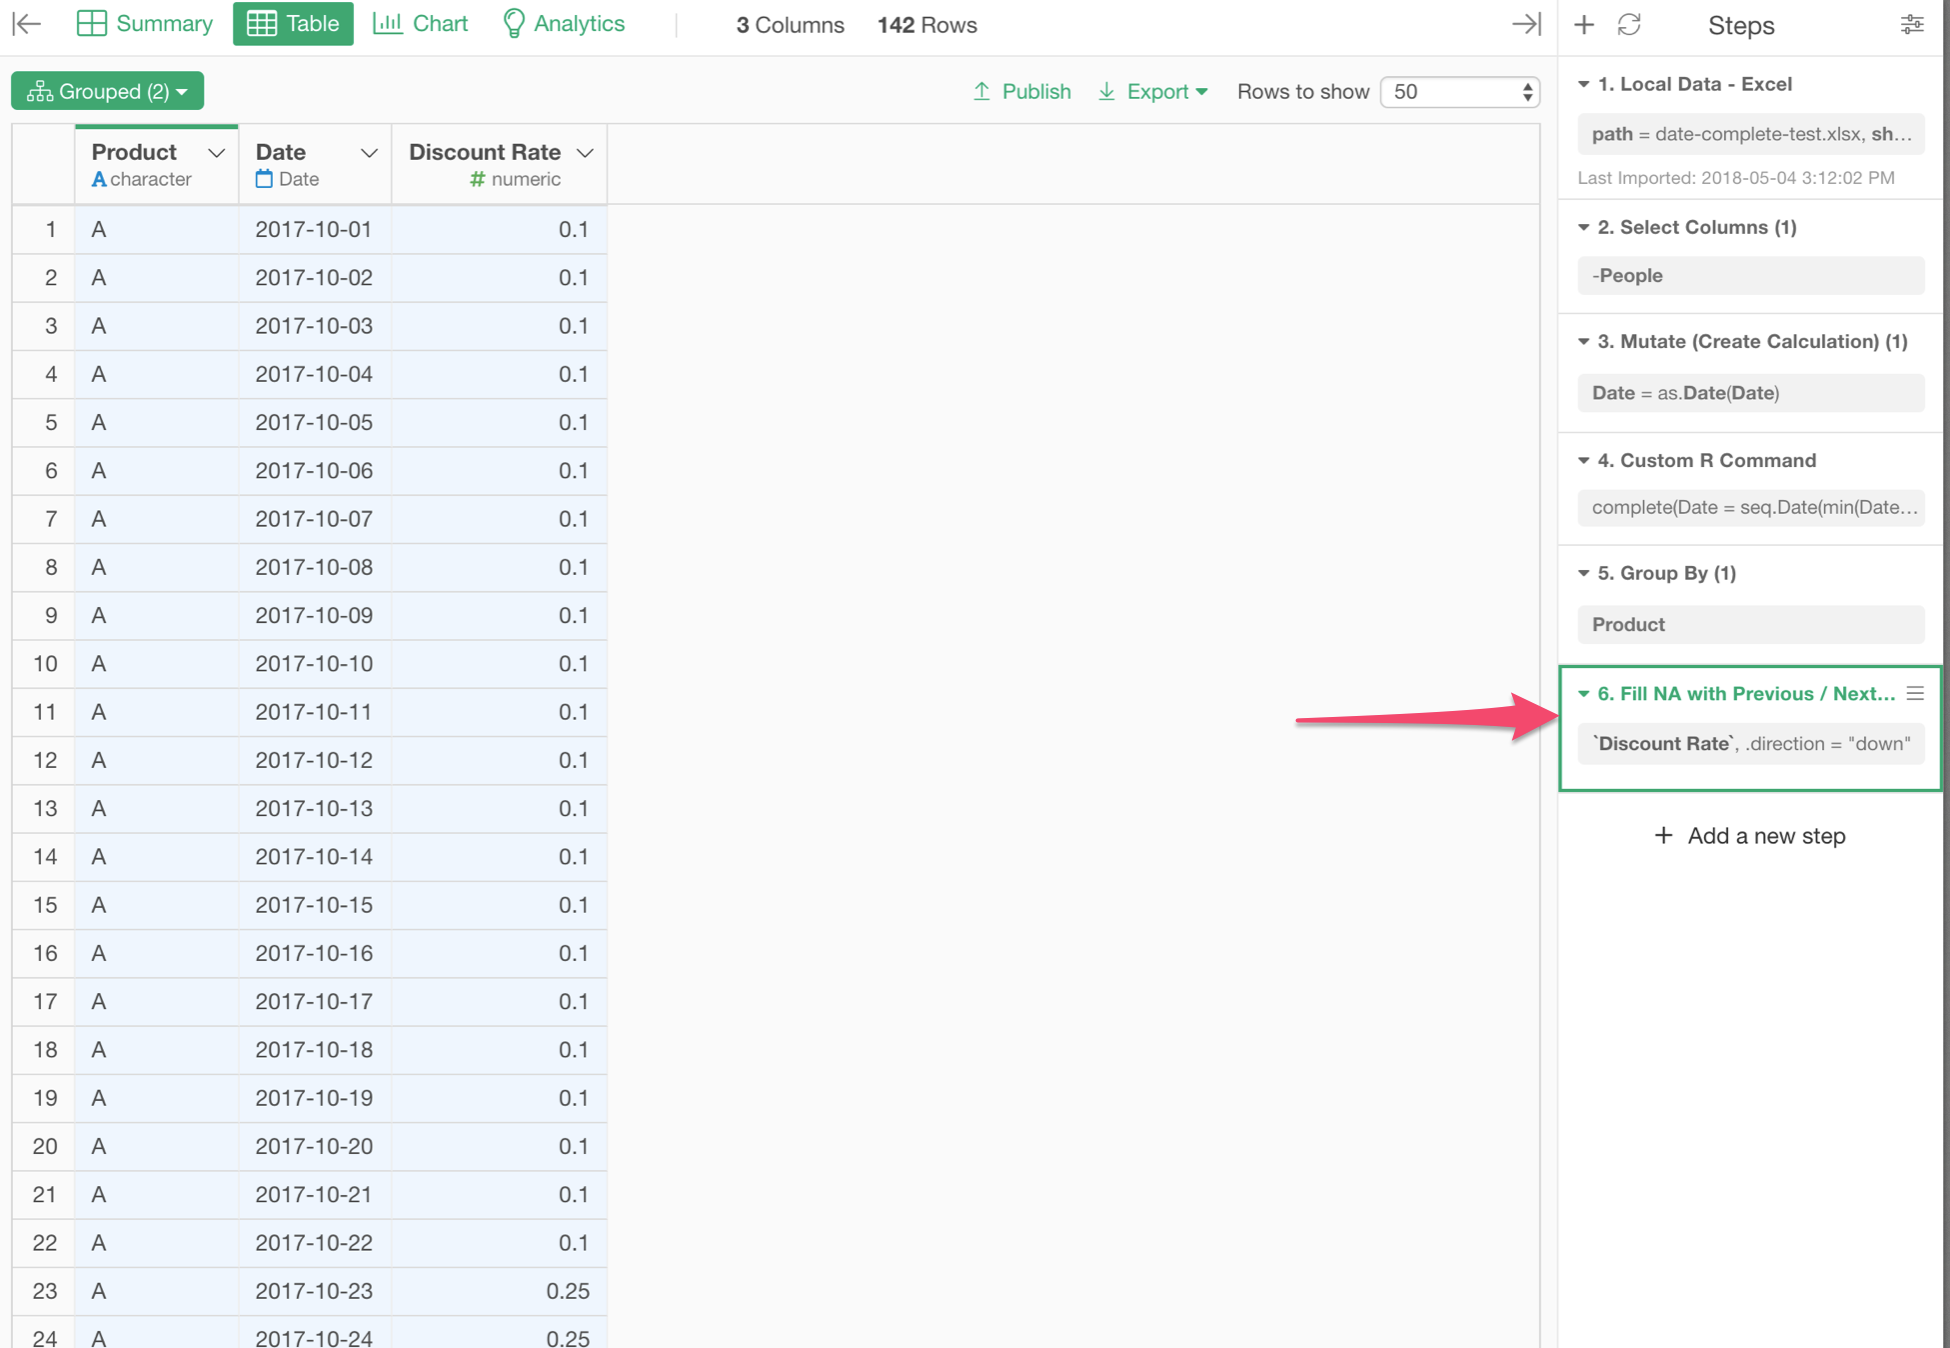
The NA filling operation has just happened in each group separately.
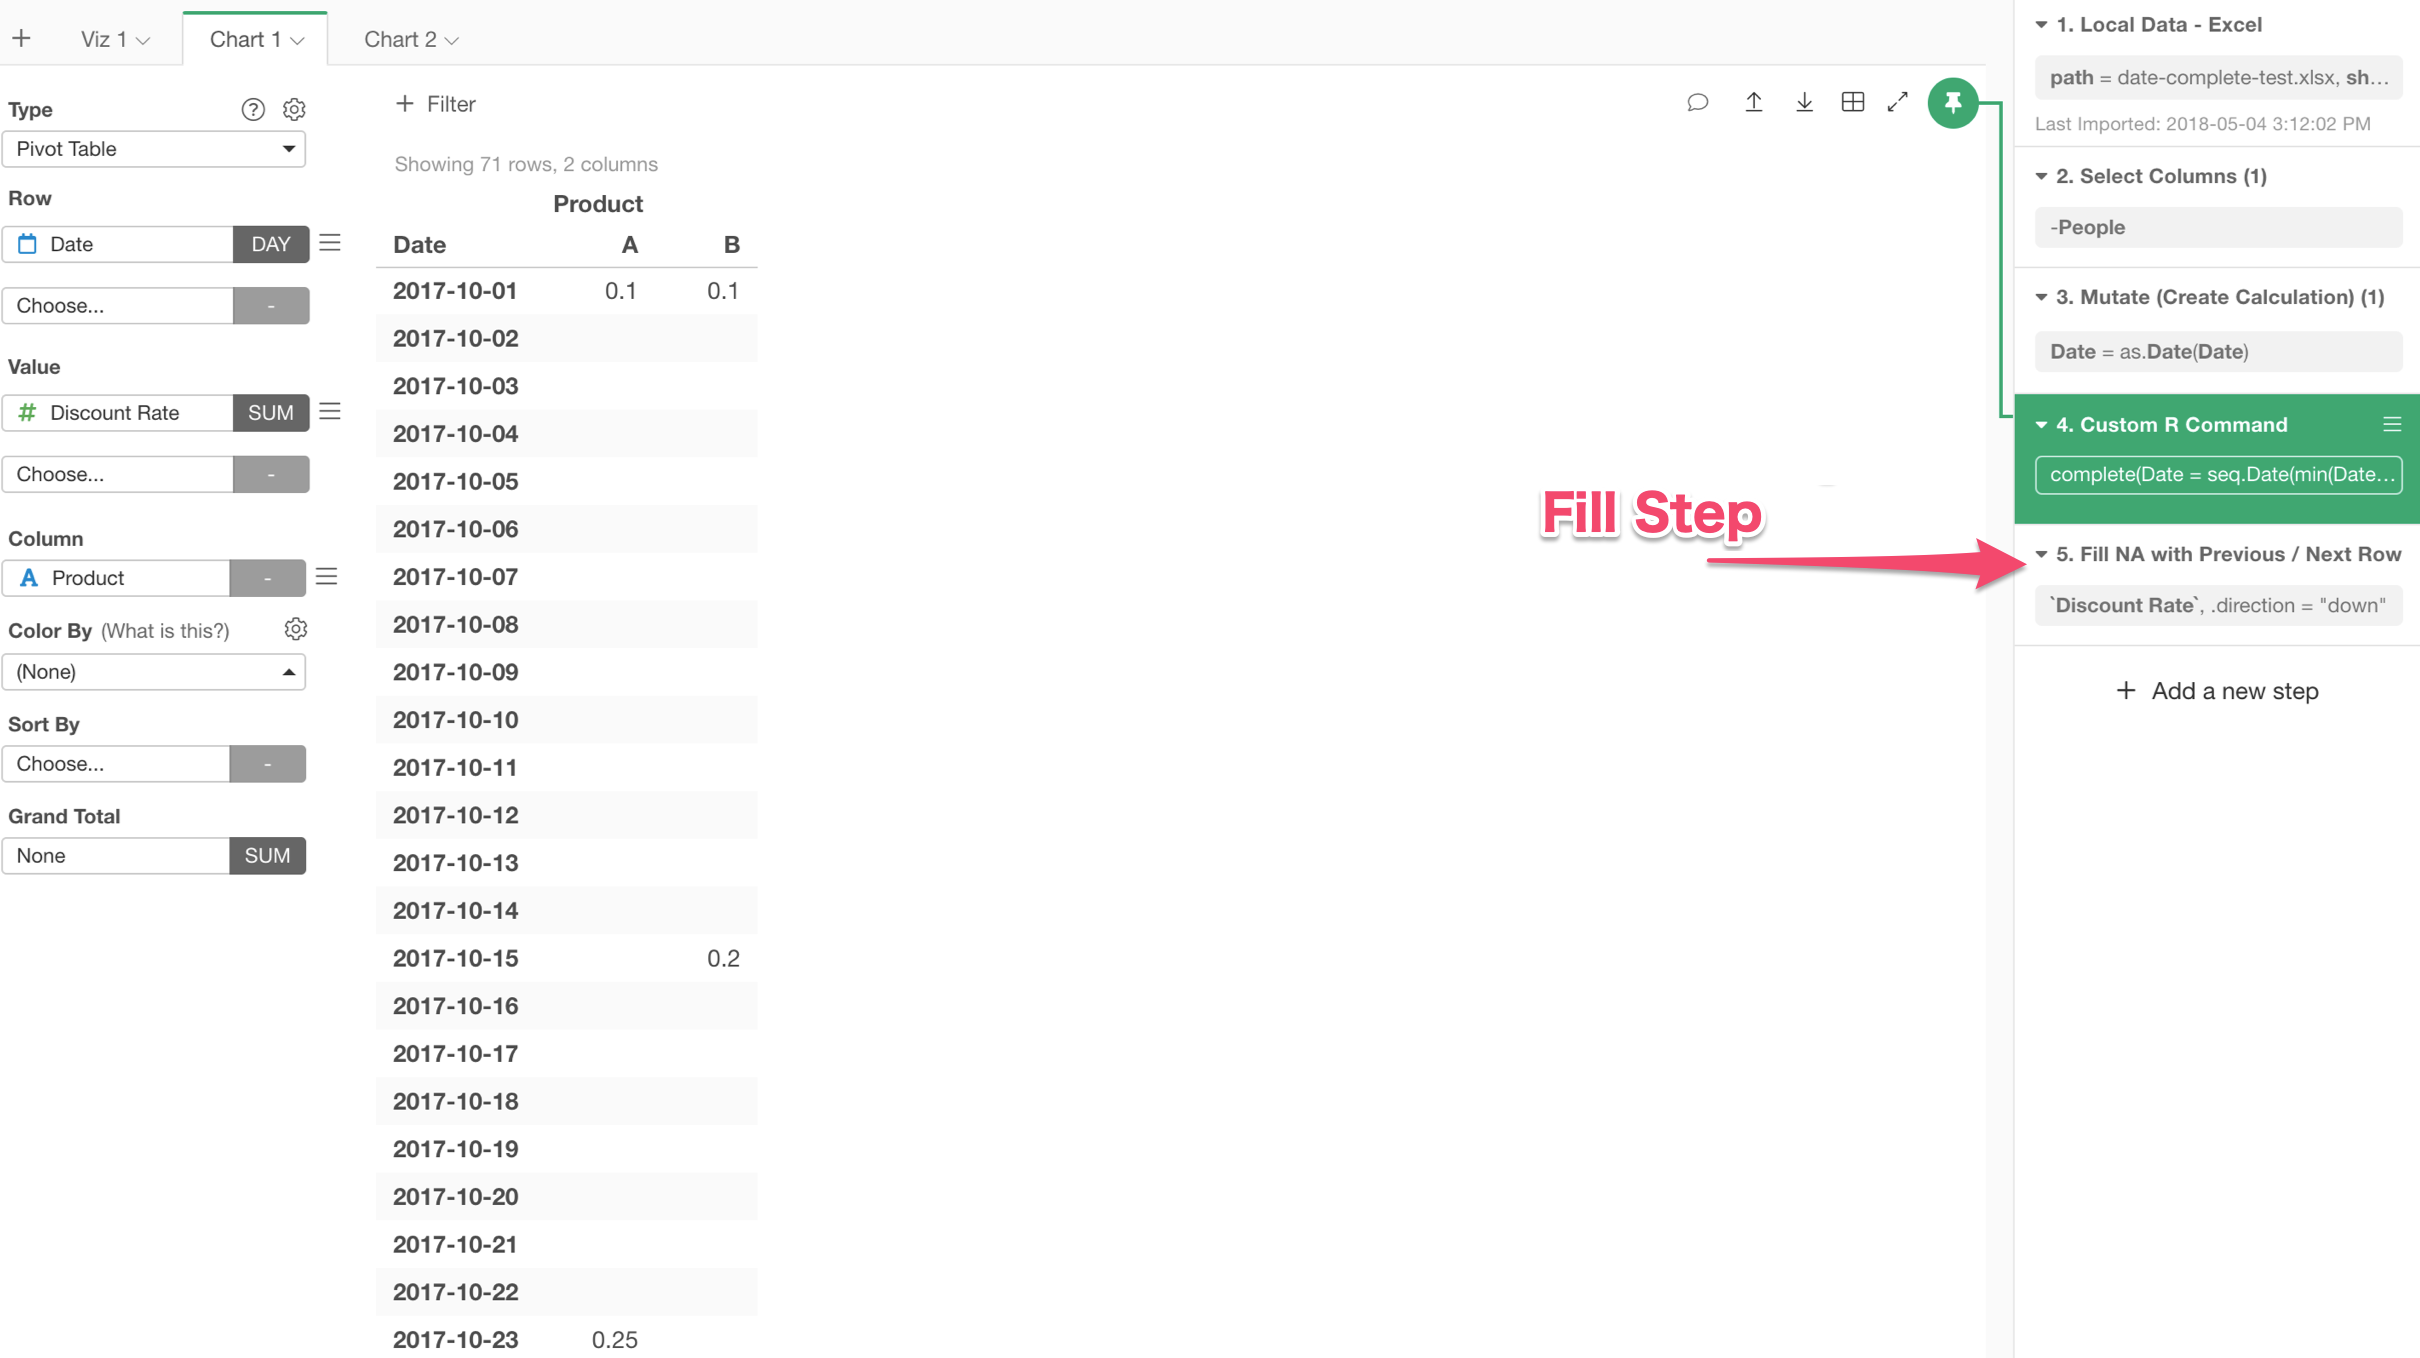
We can check that by using the same Pivot table we have created above under Chart view.
Make sure to move the Pin to the Fill step by drag-and-drop.
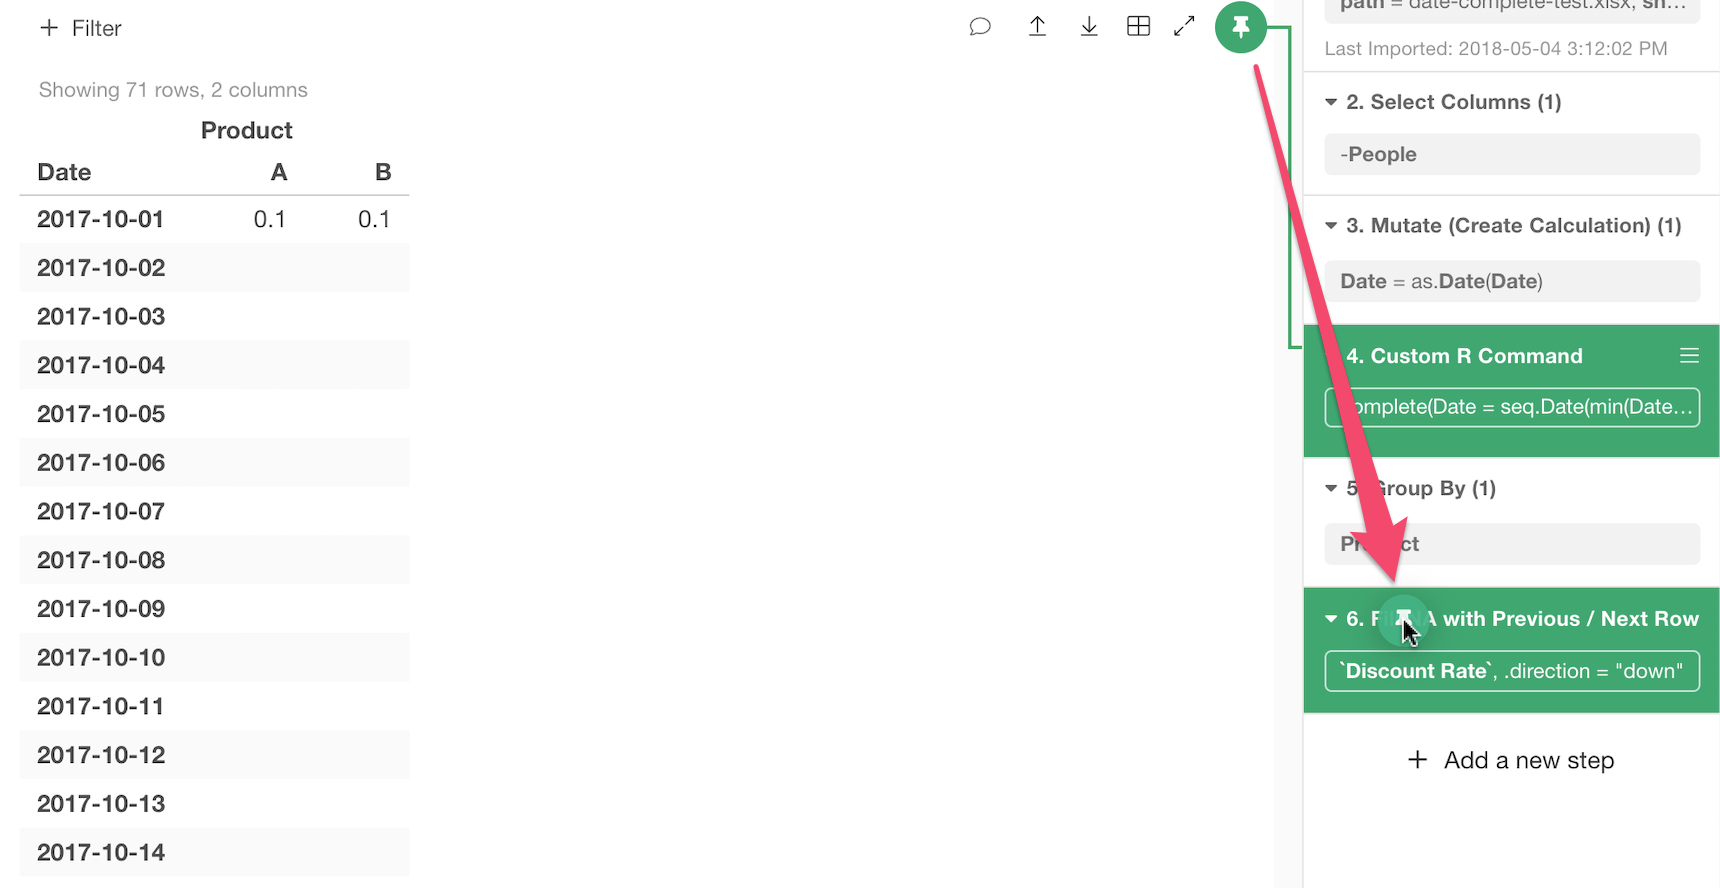
As you can see, the NAs are filled with the previously available values in each group of the product A and B separately.