How to Reverse the Order for X-Axis and Y-Axis
Sometimes you might want to change the order of X-Axis and/or Y-Axis.
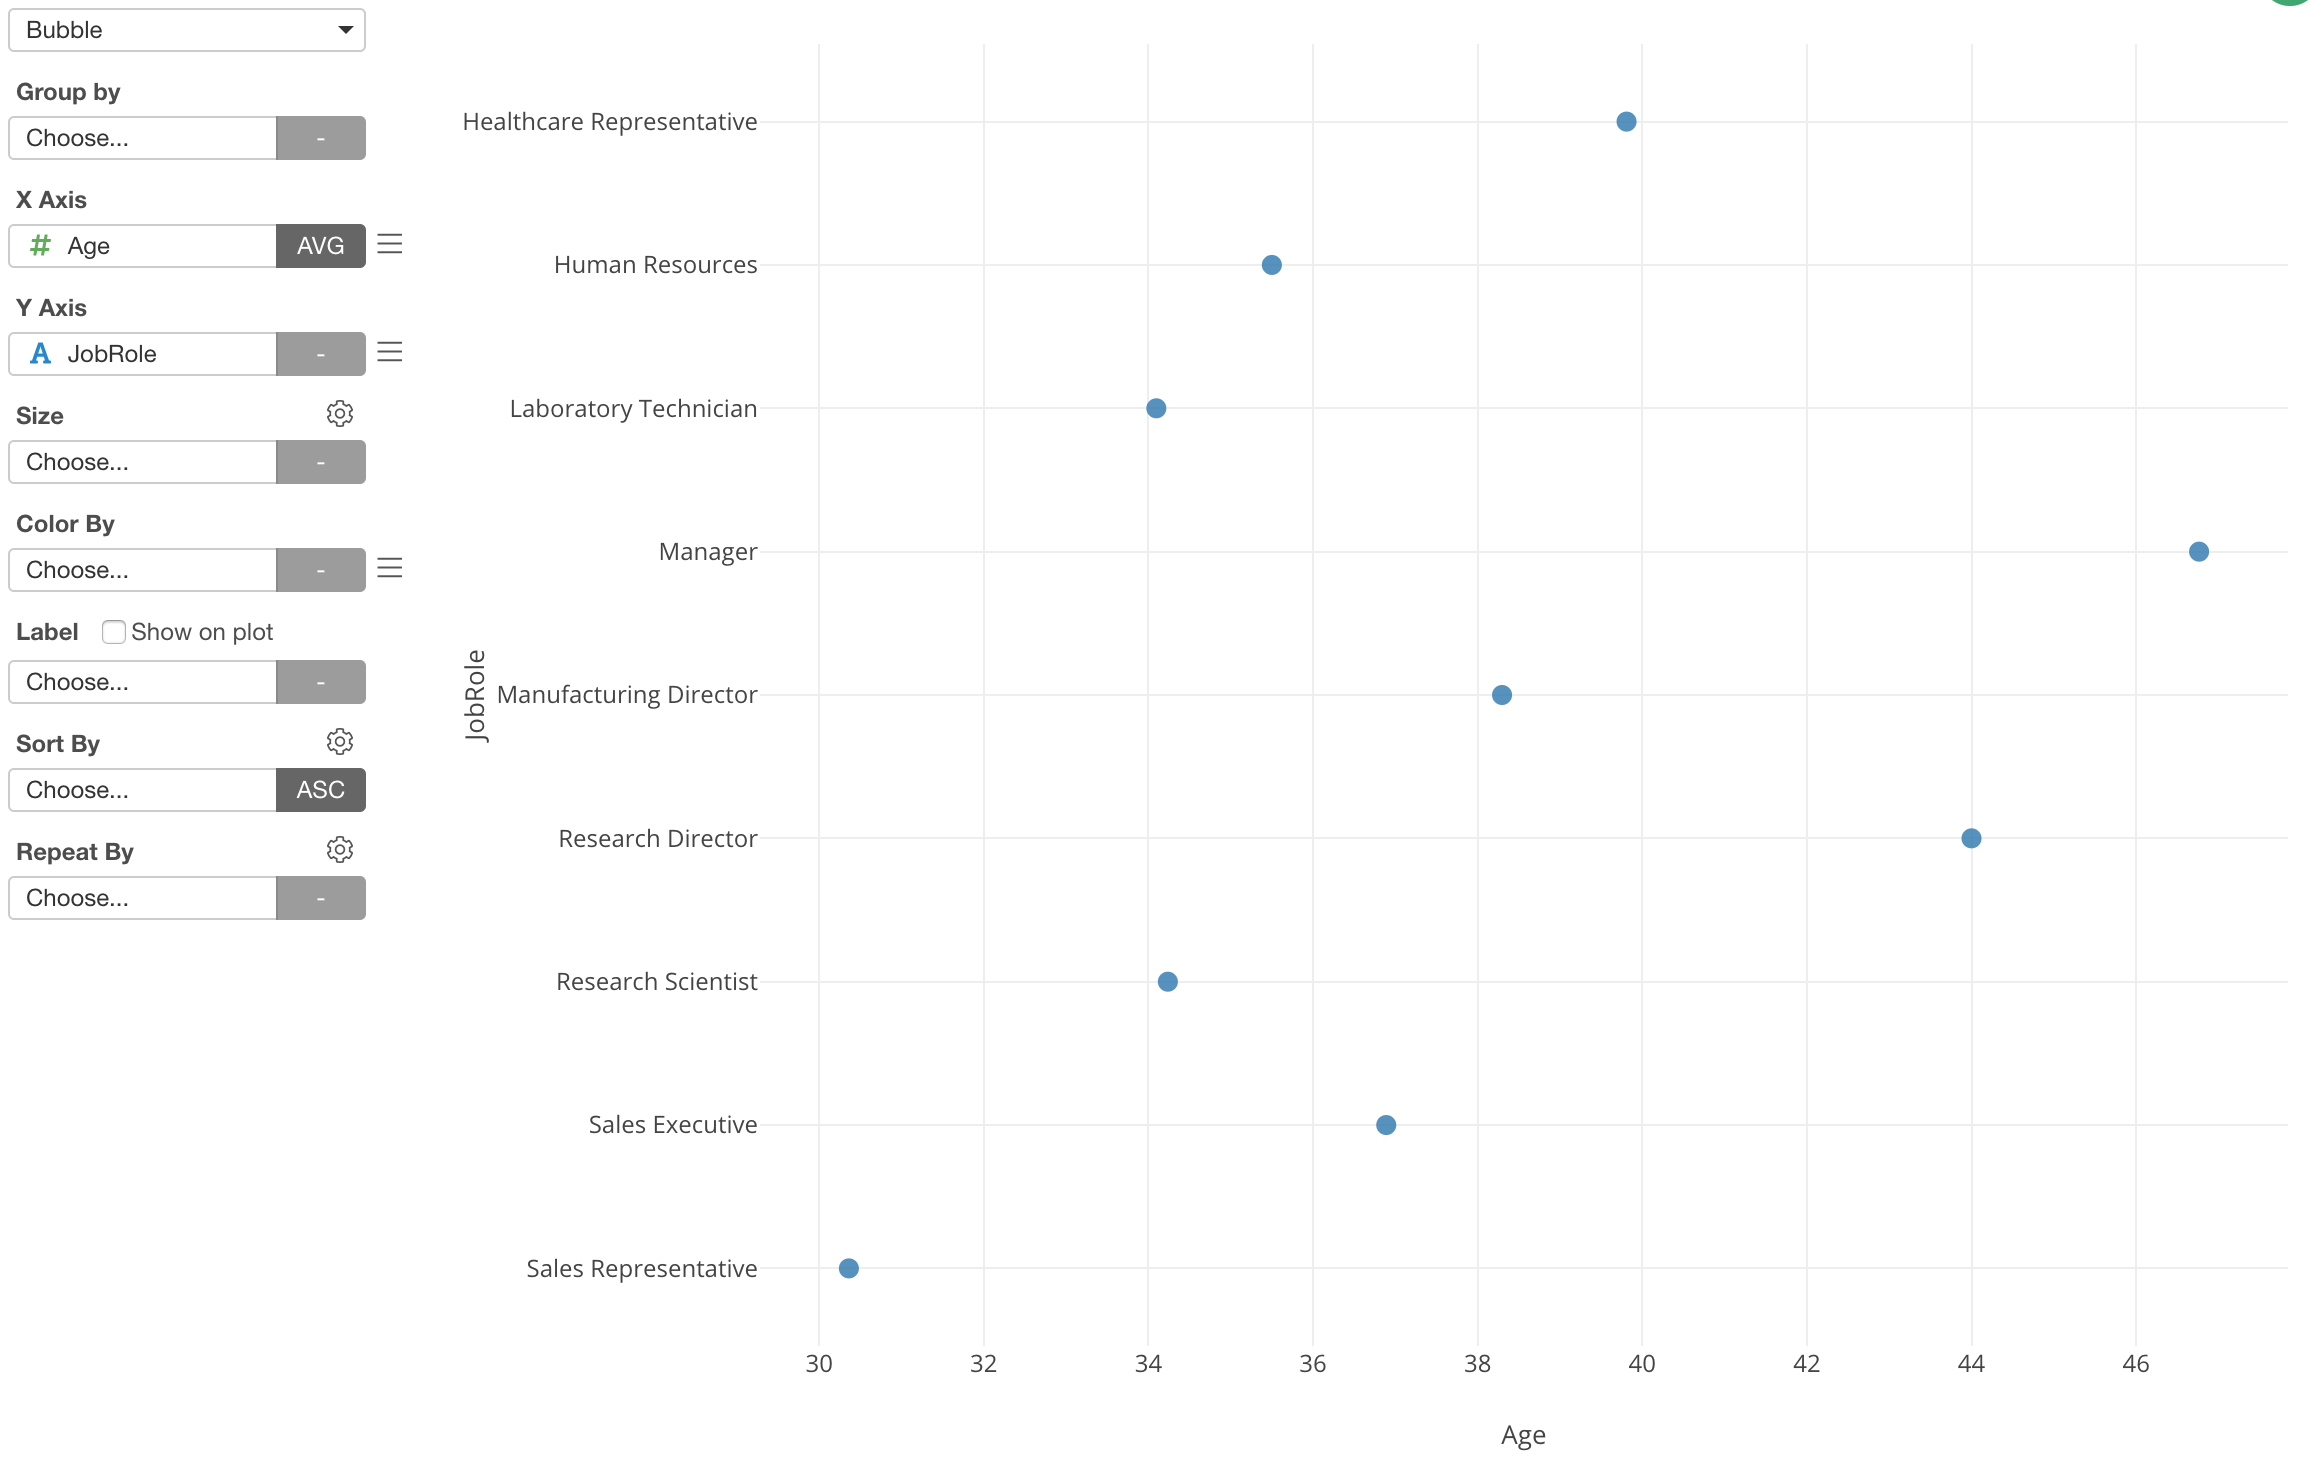
For example, here is a Bubble chart that shows the average Age by Job Type.
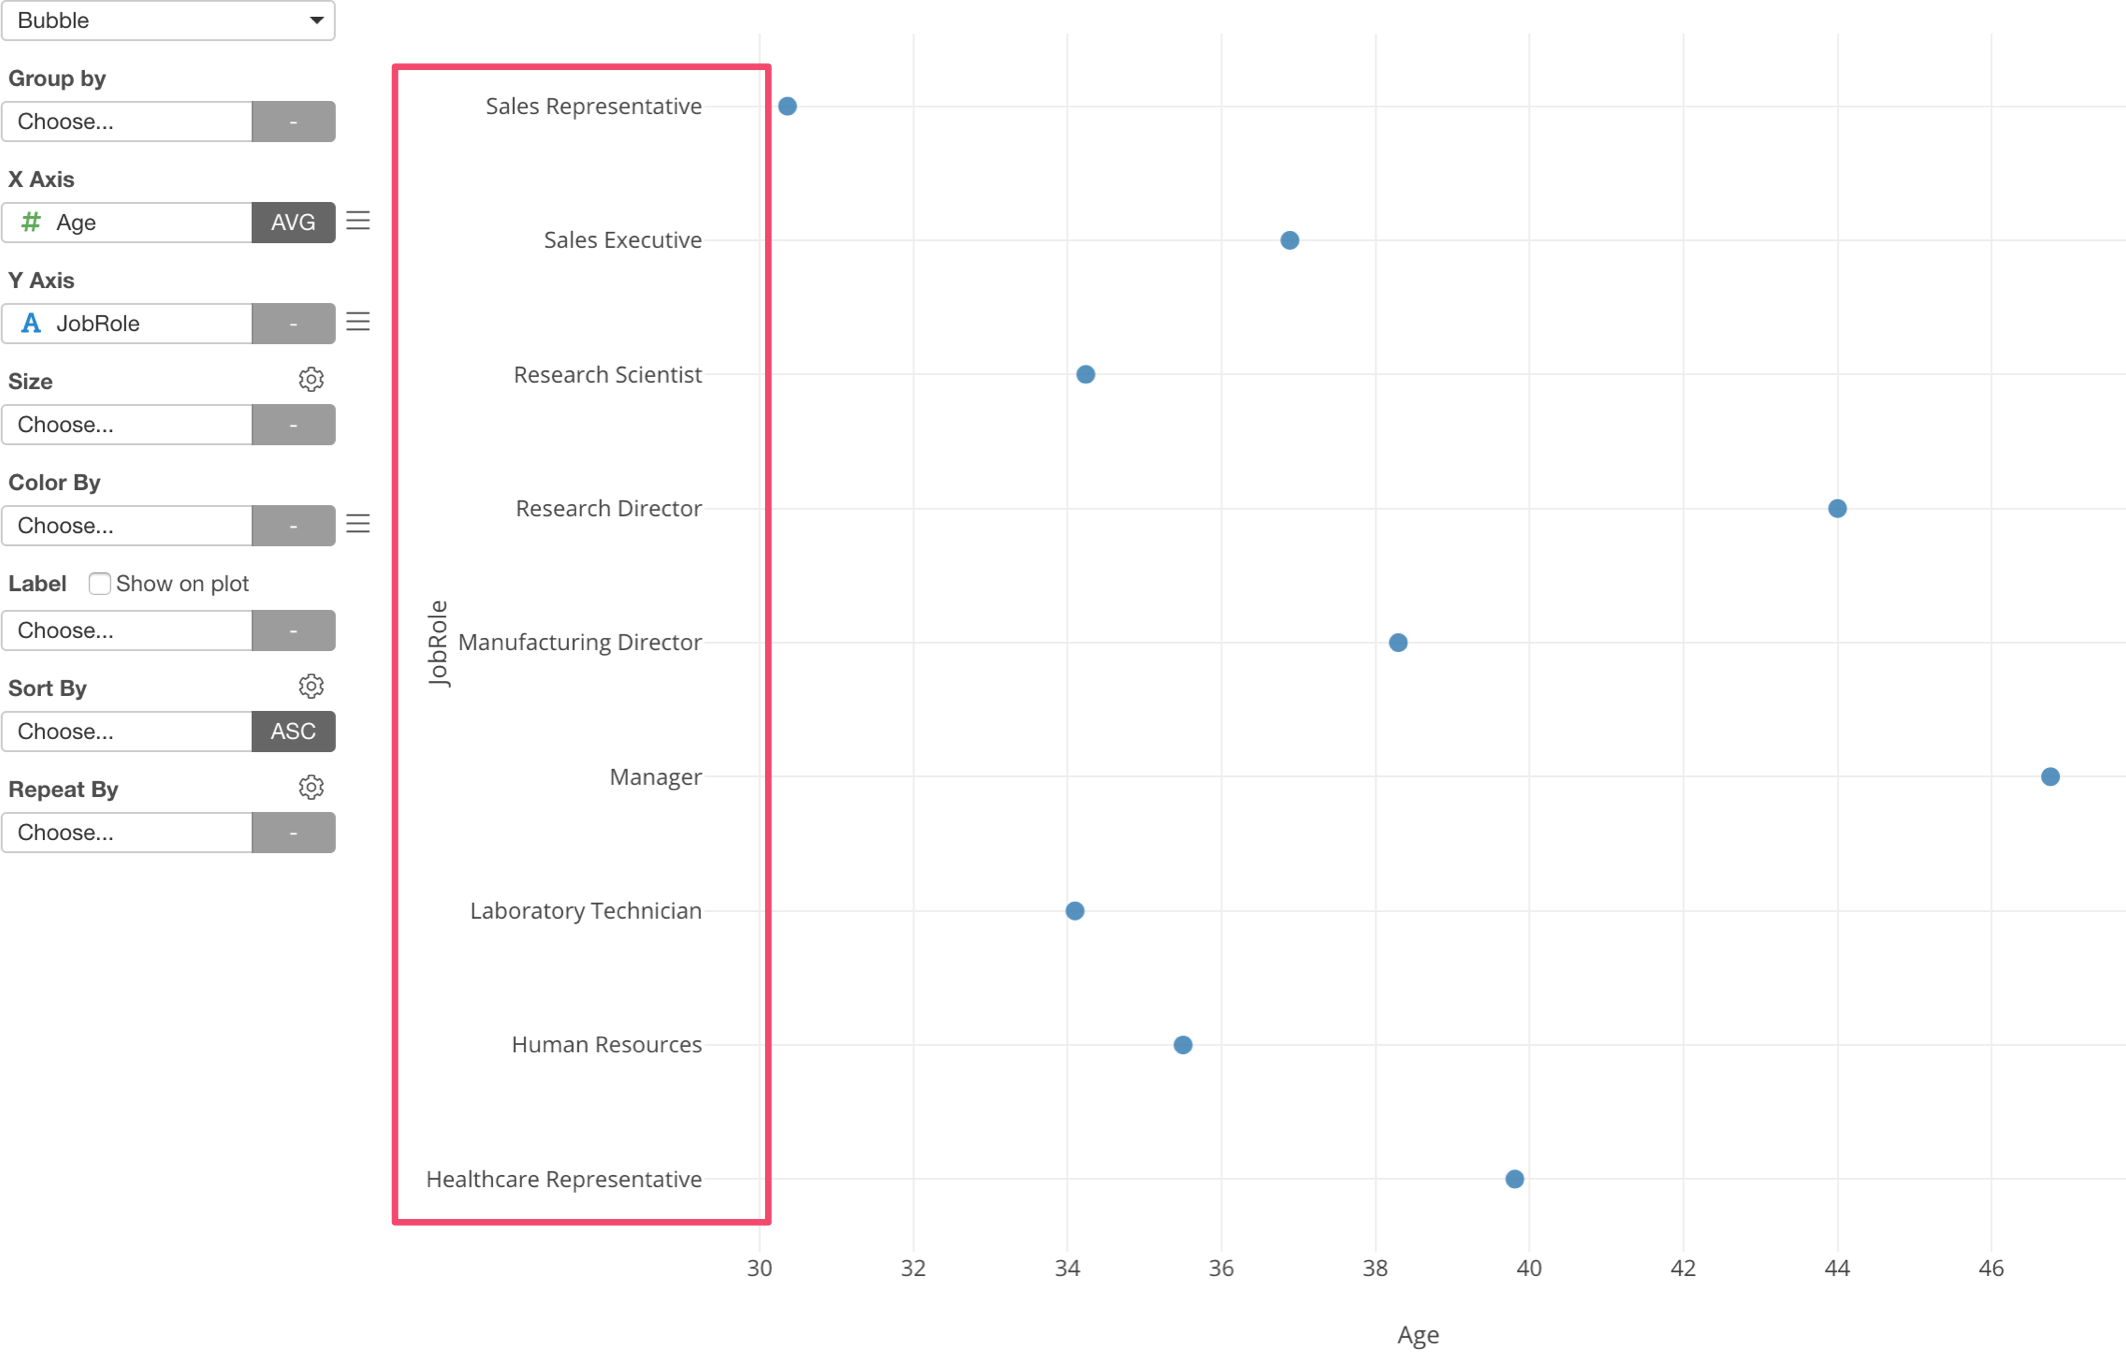
As you can see, the Job Types are sorted alphabetically but they are shown from the bottom to the top.
But, it would be much easier to read by showing them from the top to the bottom.
You can change the display order by selecting ‘Y Axis Sort Order’ from the Y-Axis menu dropdown.
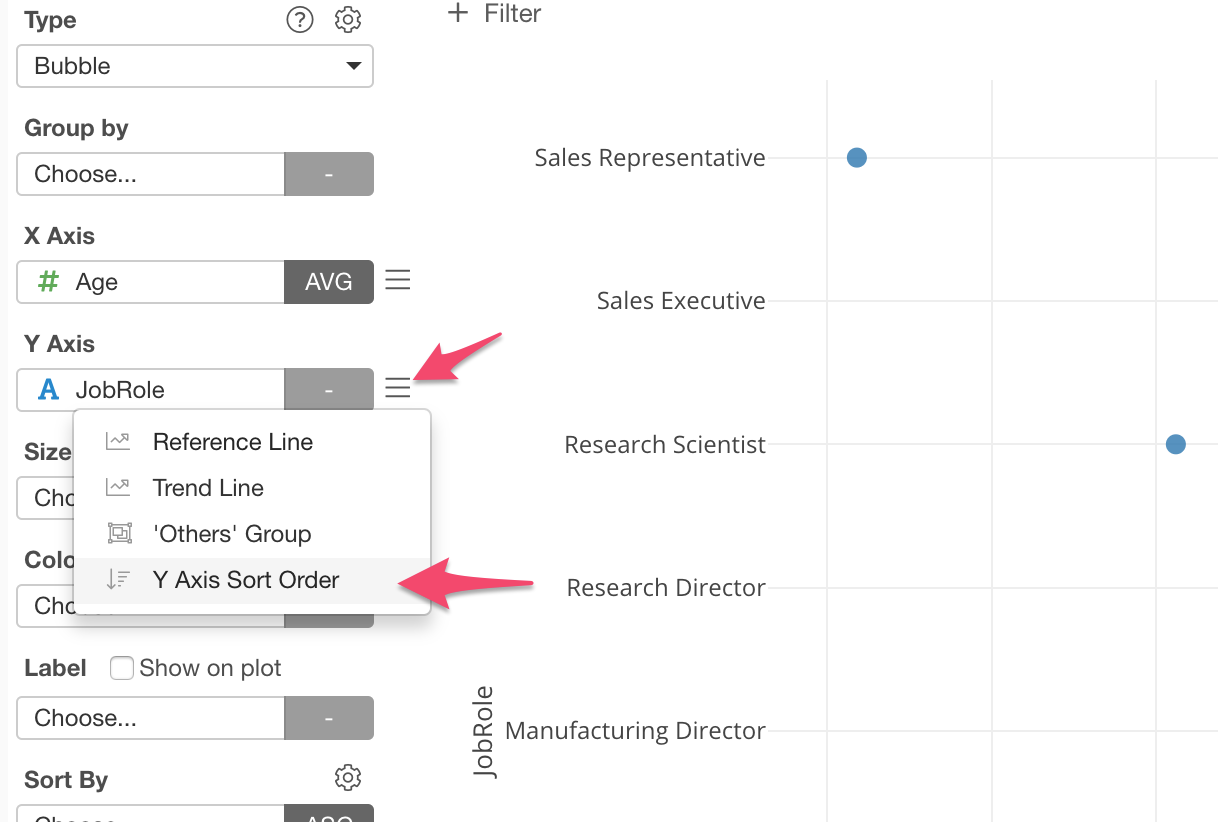
Then, select ‘Bottom to Top’ for ‘Axis Sort Order.
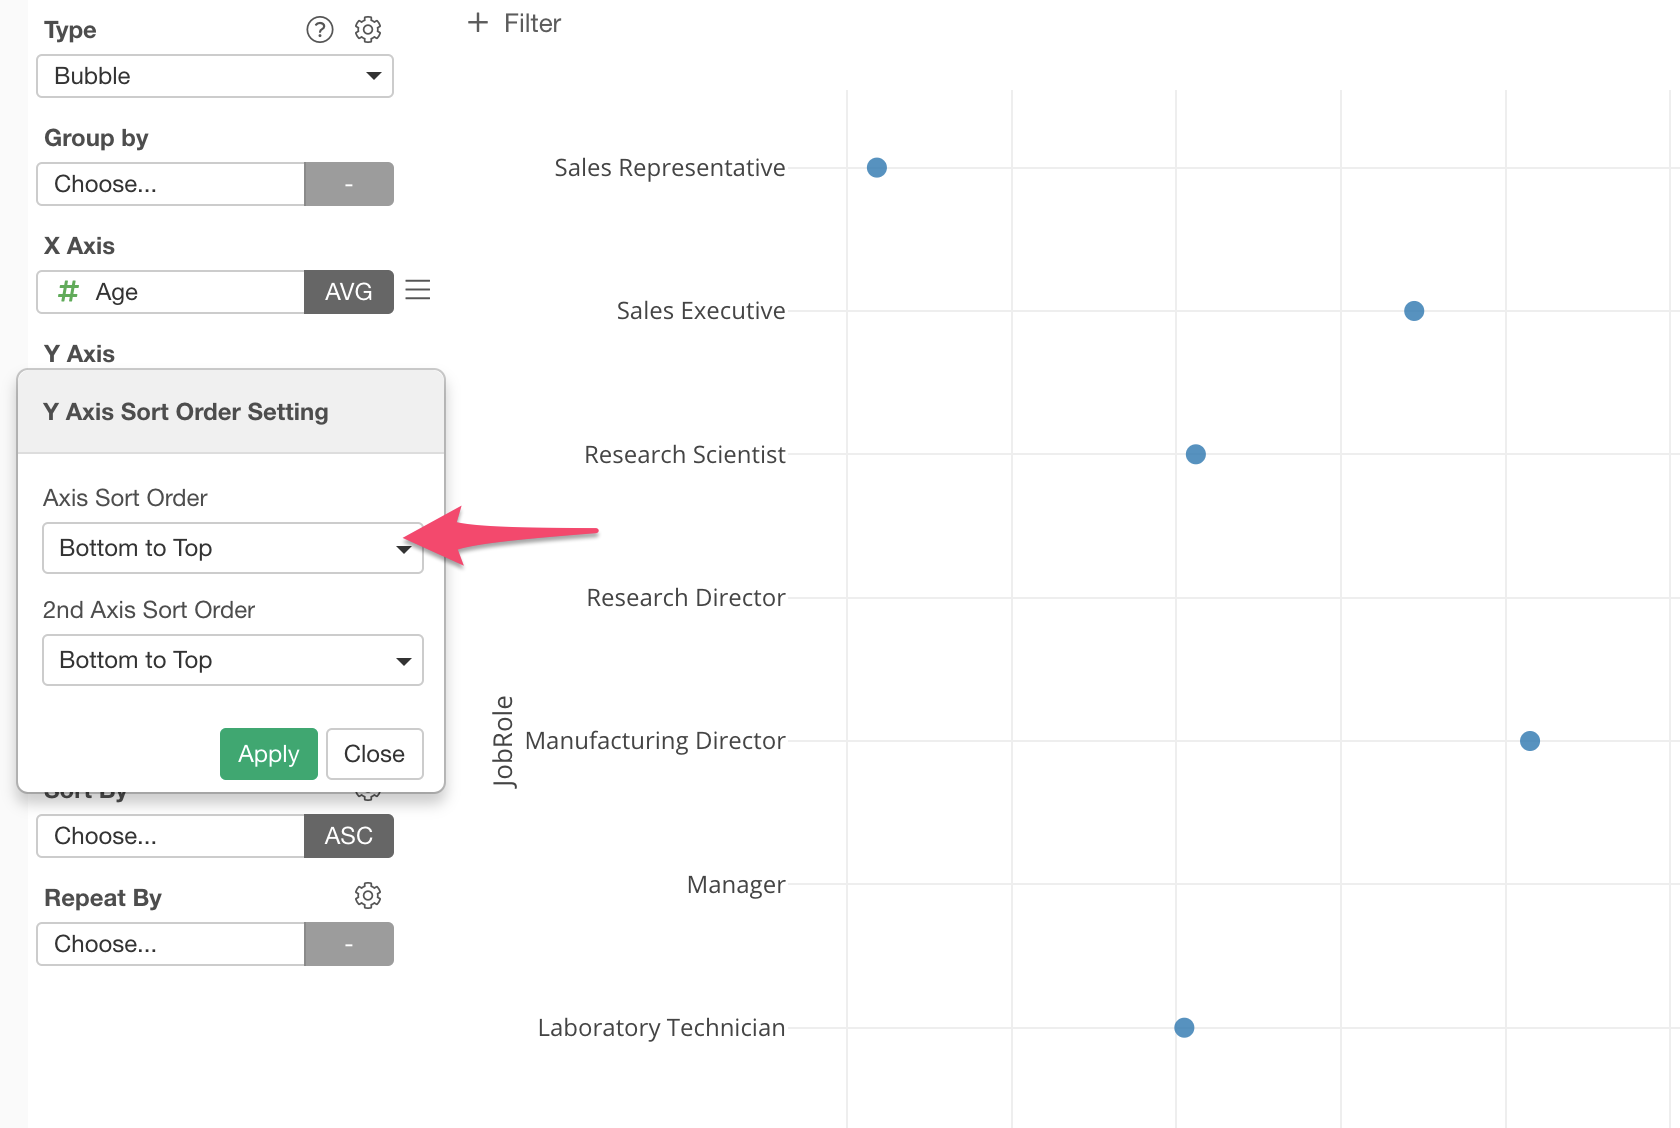
Now the Job Types are alphabetically sorted and shown from the top to the bottom.
Reverse the Order of Factor Column in Chart
You might have known this, but there is a data type called Factor in R and therefore in Exploratory. It is designed to be used for ordered categorical variables (columns).
Very similar to Character data type except that it can have the order information within the data itself.
And of course, all the charts inside Exploratory respect the order defined inside the ‘Factor’ data.
Let’s say we have grouped the customers based on how recent they have made any purchases into the following 5 groups.
- Very Recent
- Recent
- Neutral
- Old
- Very Old
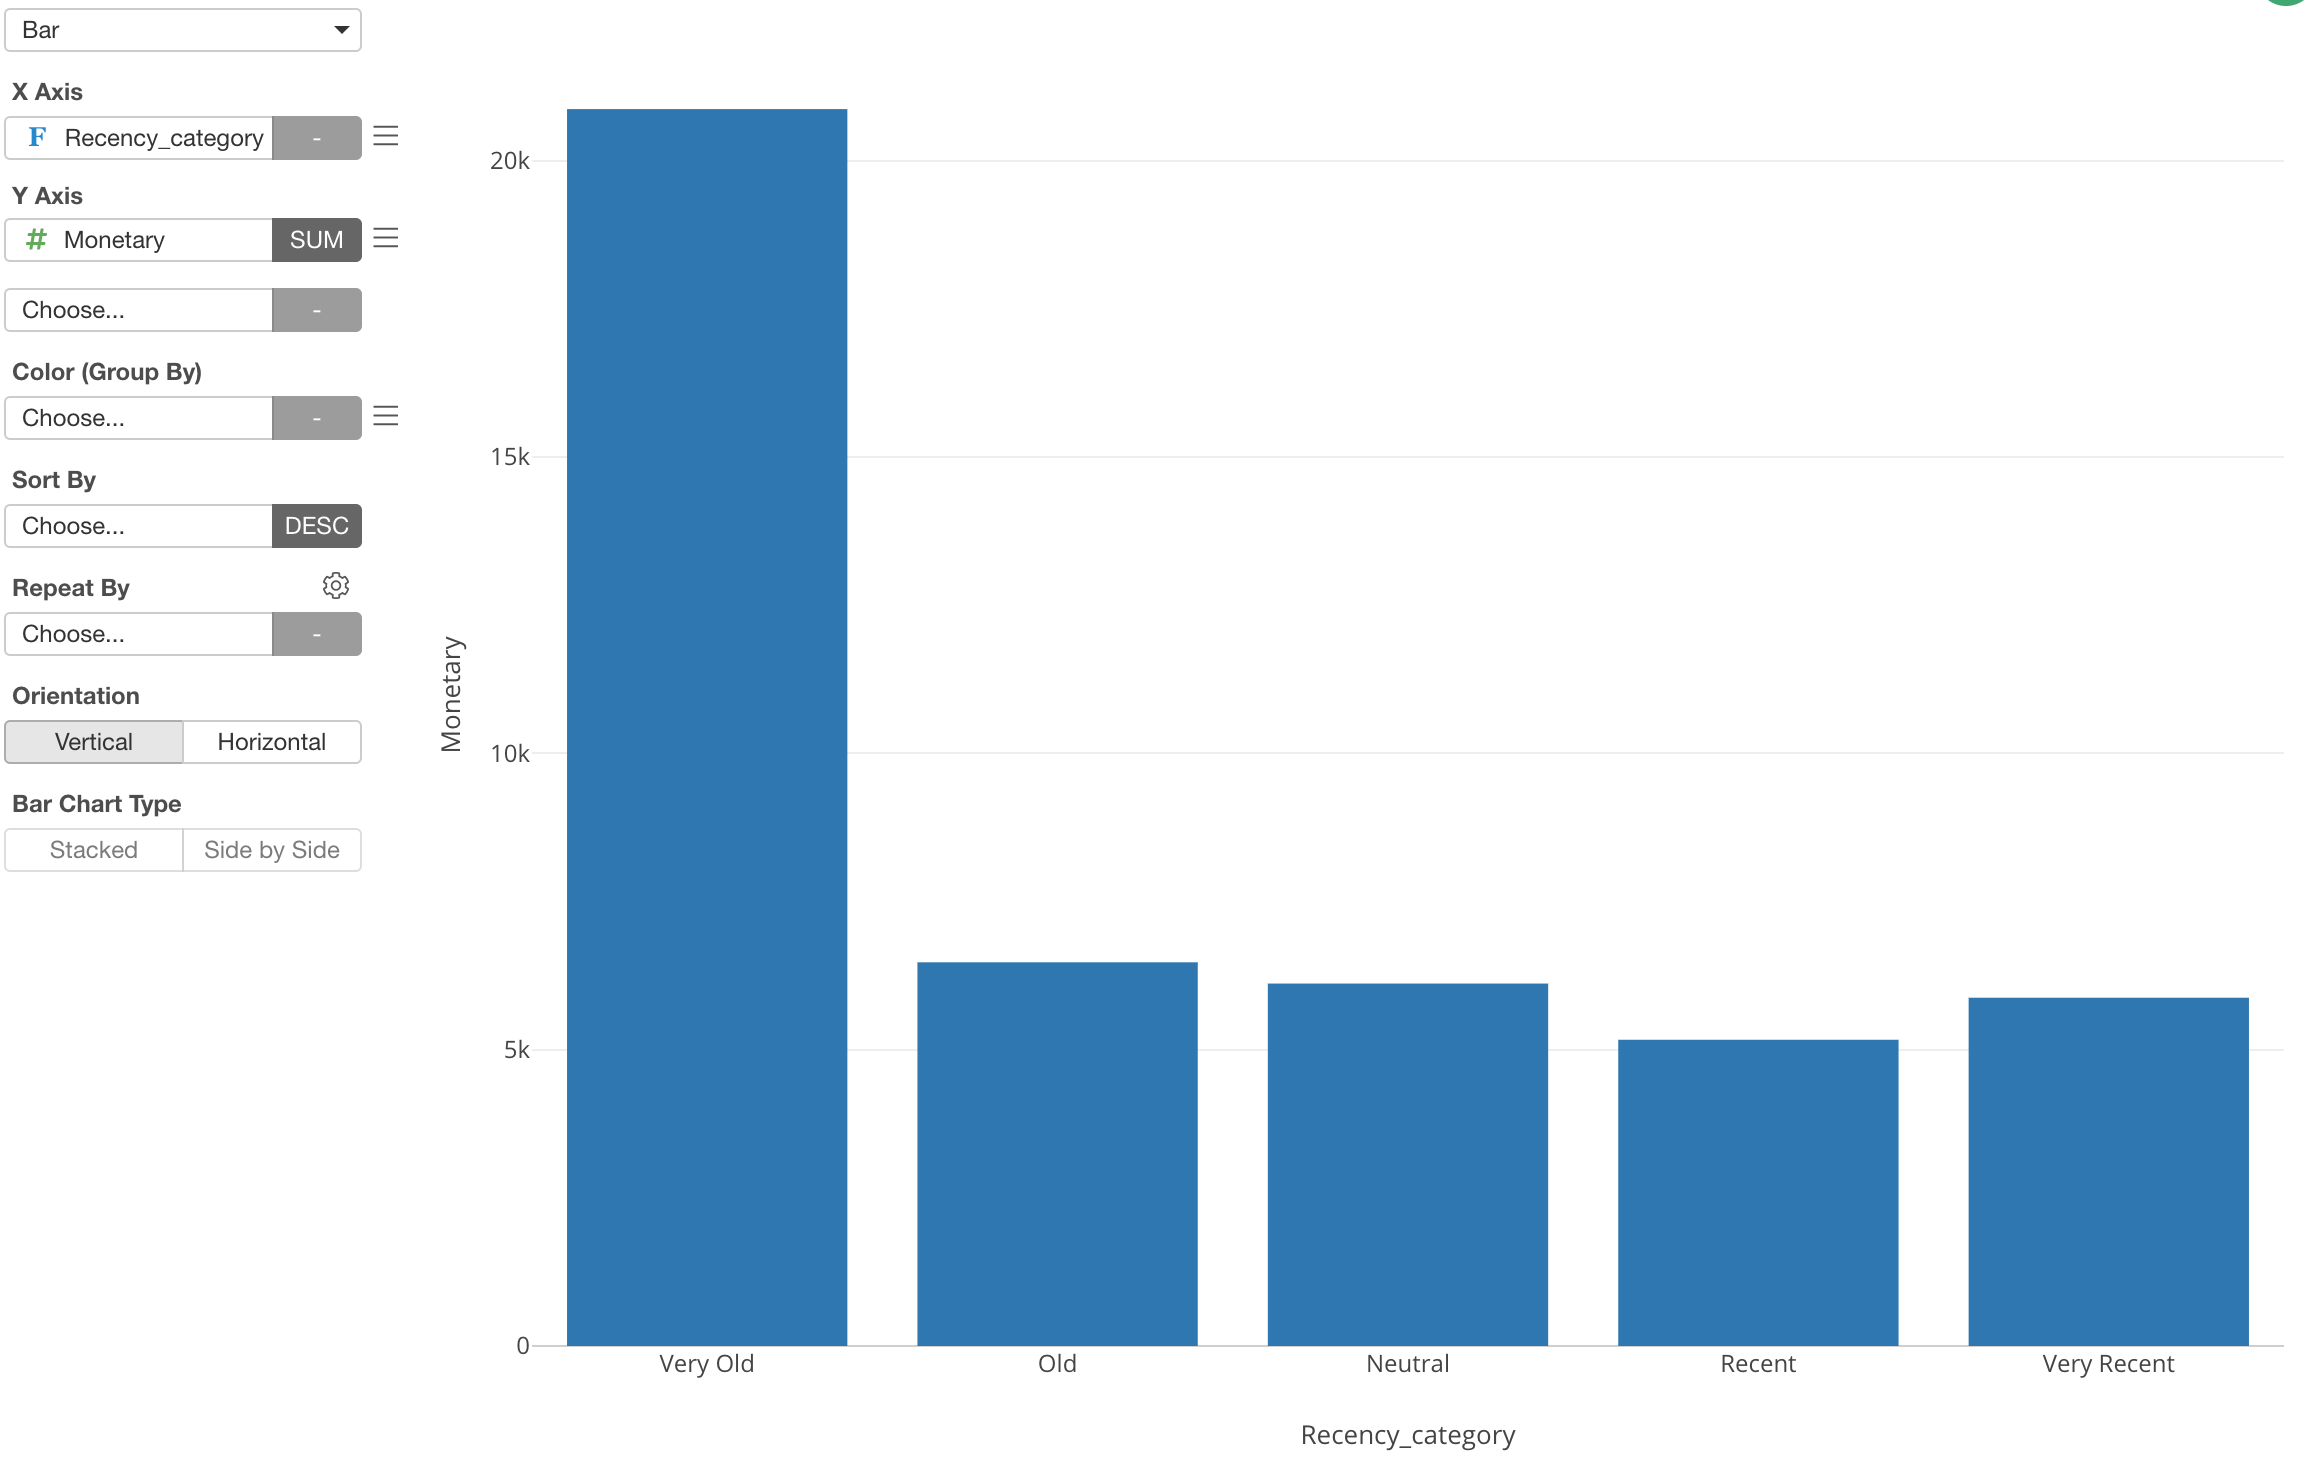
Here is a bar chart that shows each customer’s group’s spending amount.
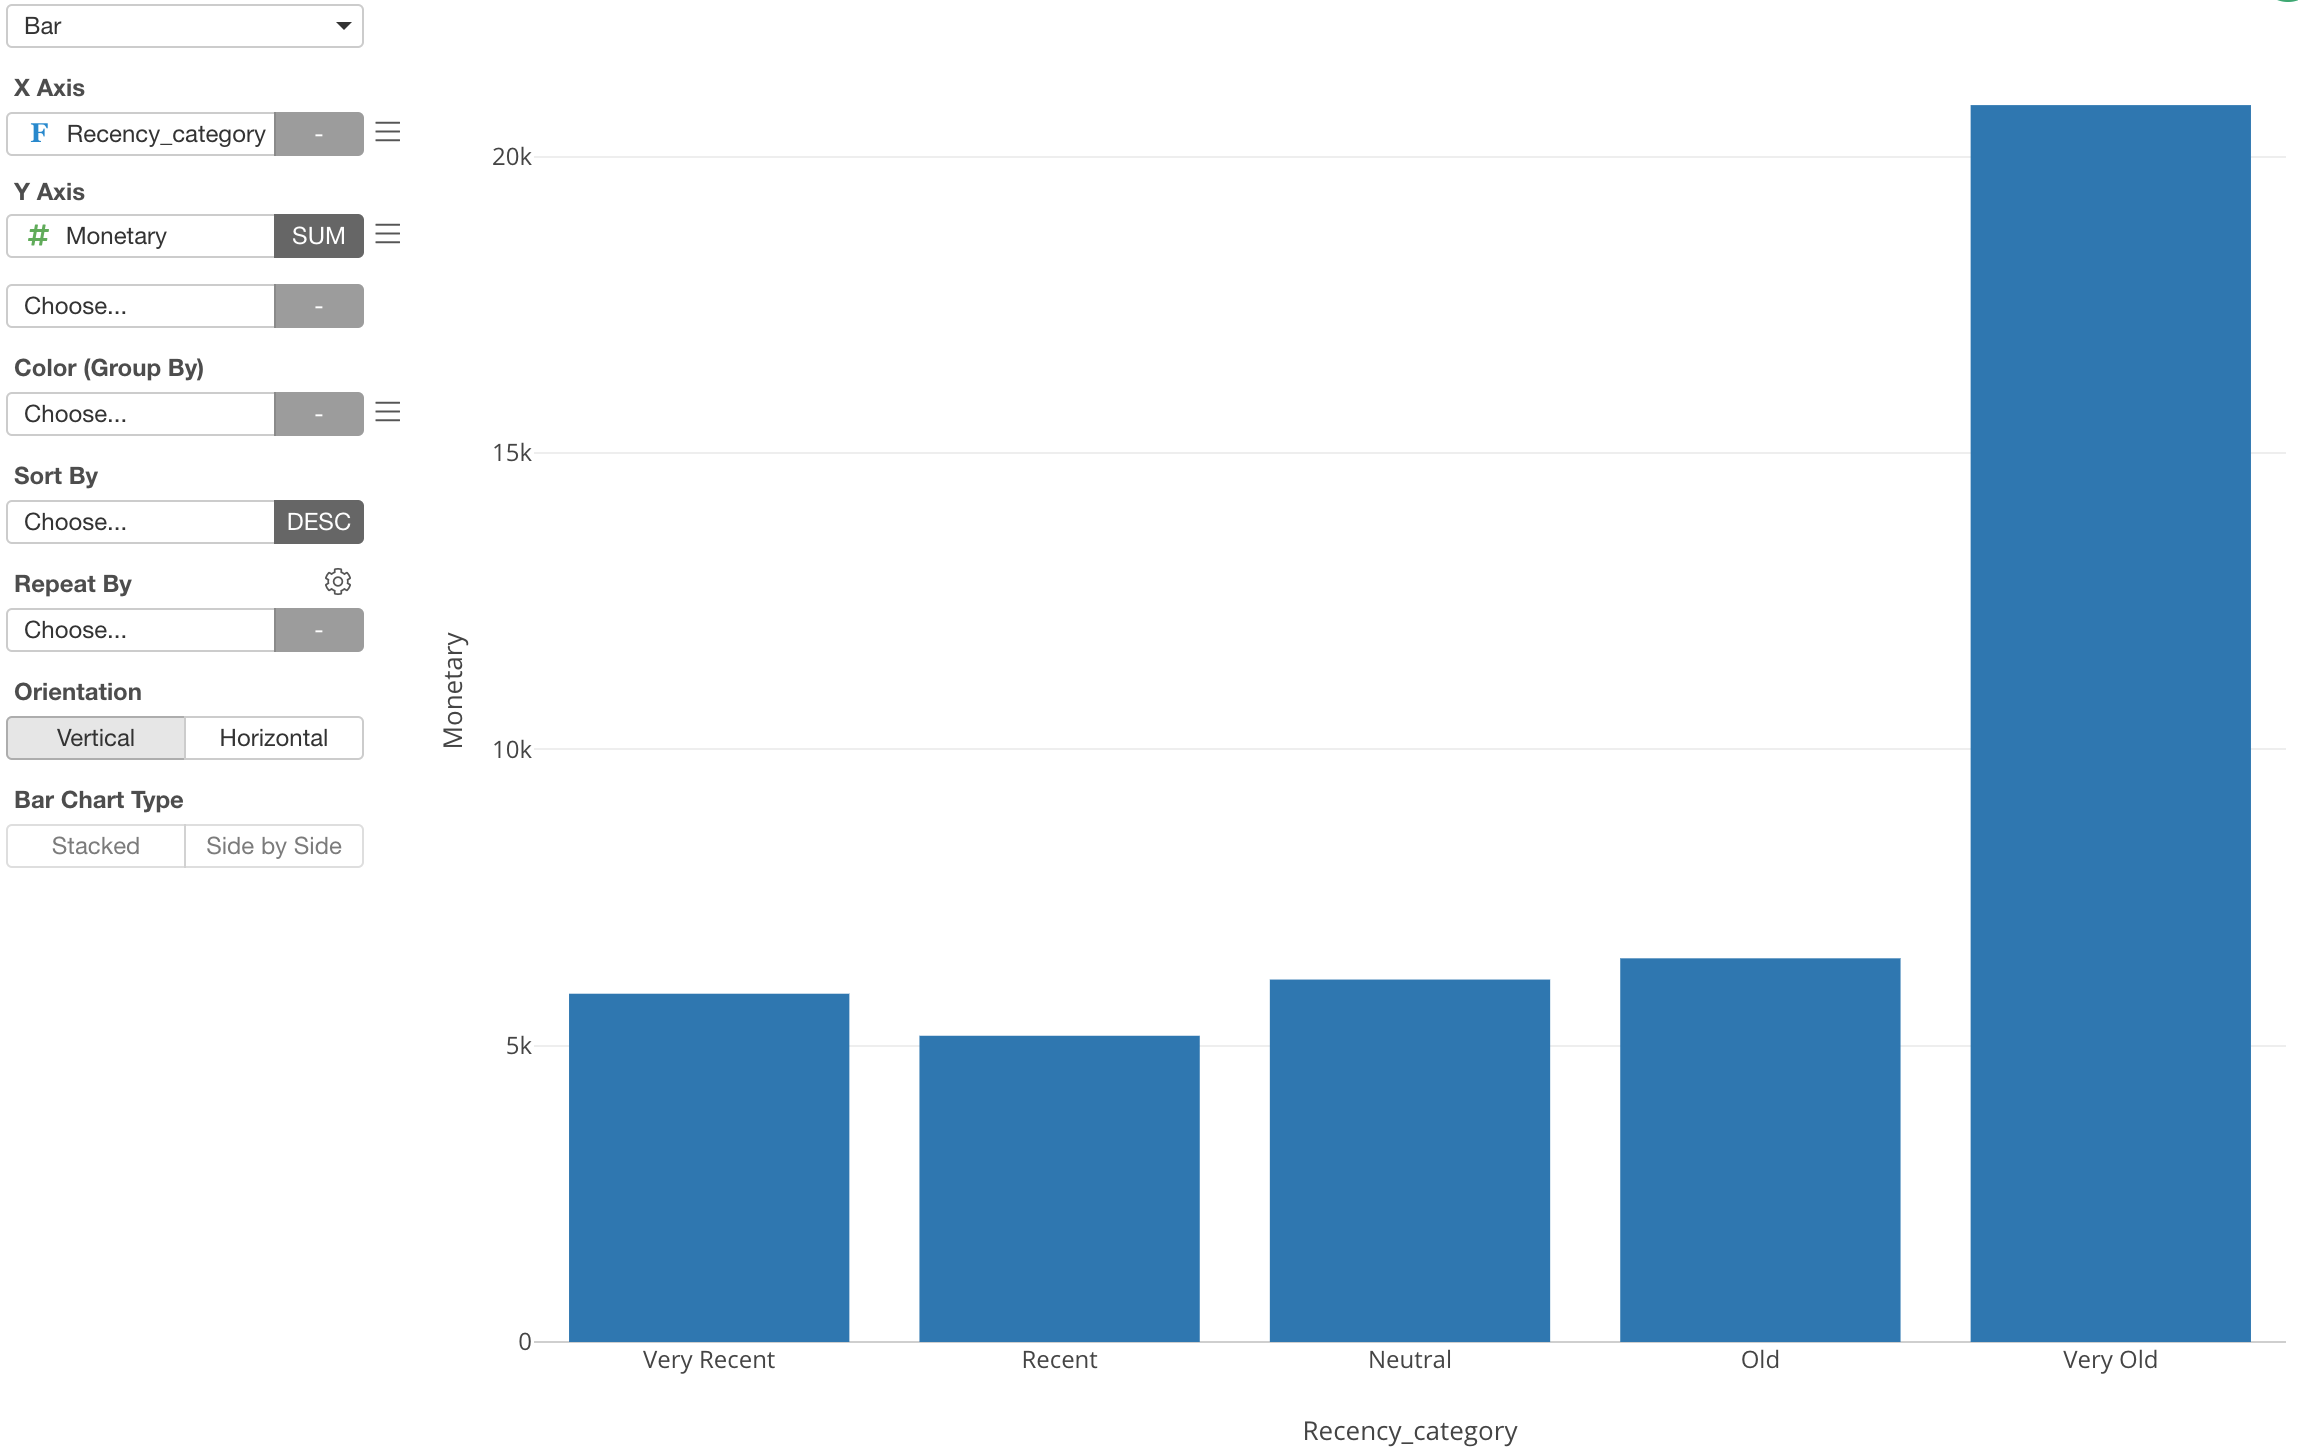
We can see the groups are sorted from the most recent one to the oldest one if you read from the left to the right. This is because the column that is assigned to X-Axis is Factor type and its order is defined as above.
But, since most of us are used to read time-related information from the left to the right, this could be confusing.
It would be much better if it starts from the older group at the left and to the more recent group at the right.
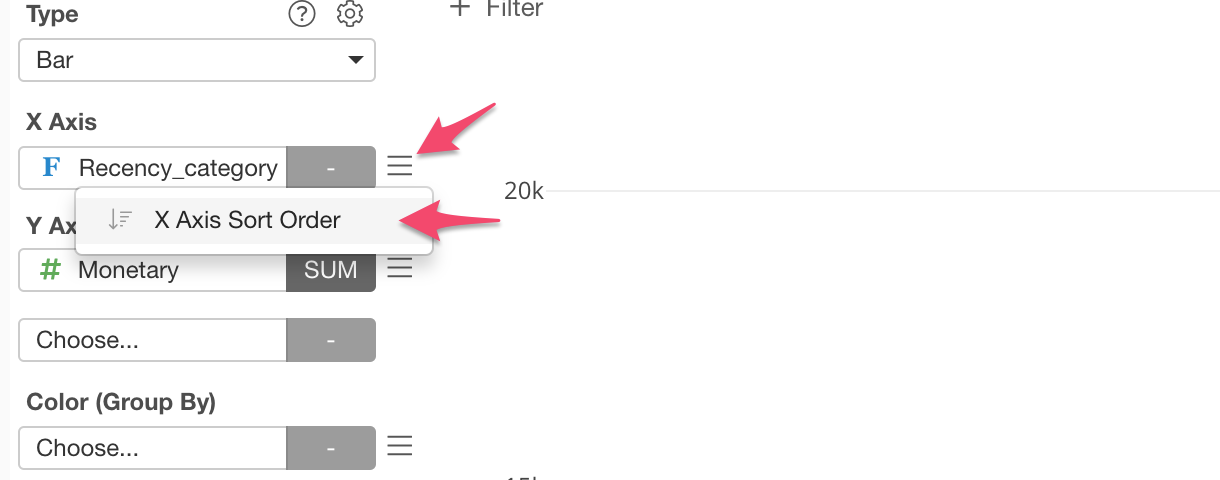
Select ‘X Axis Sort Order’ from the X-Axis dropdown menu.
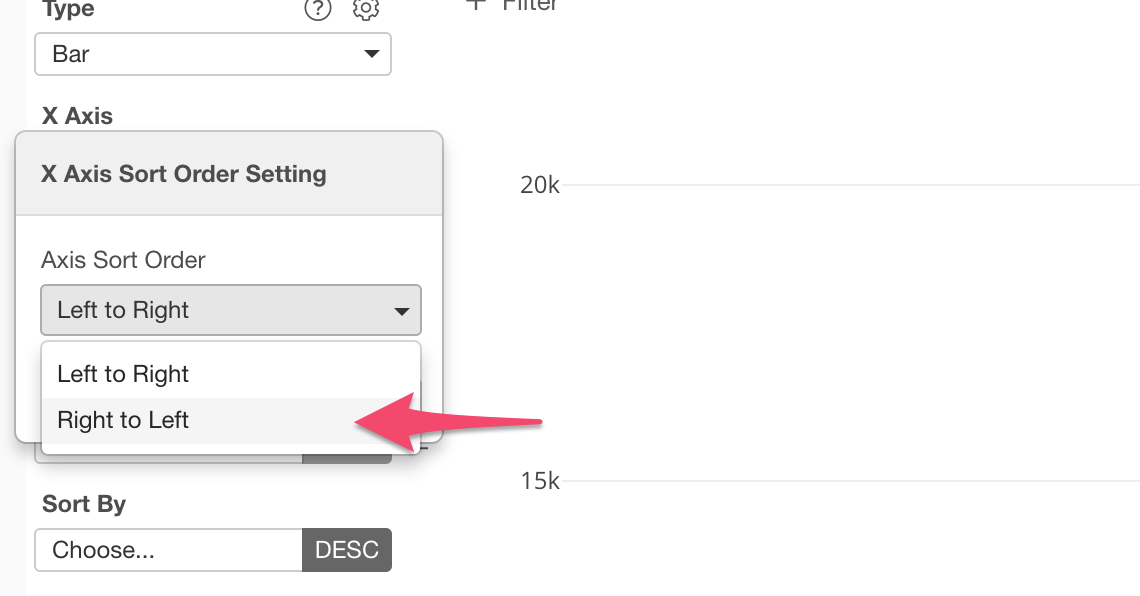
And reverse the order by selecting ‘Right to Left’.
Now the order starts with the older group at the left and it looks much easier to read! 💪